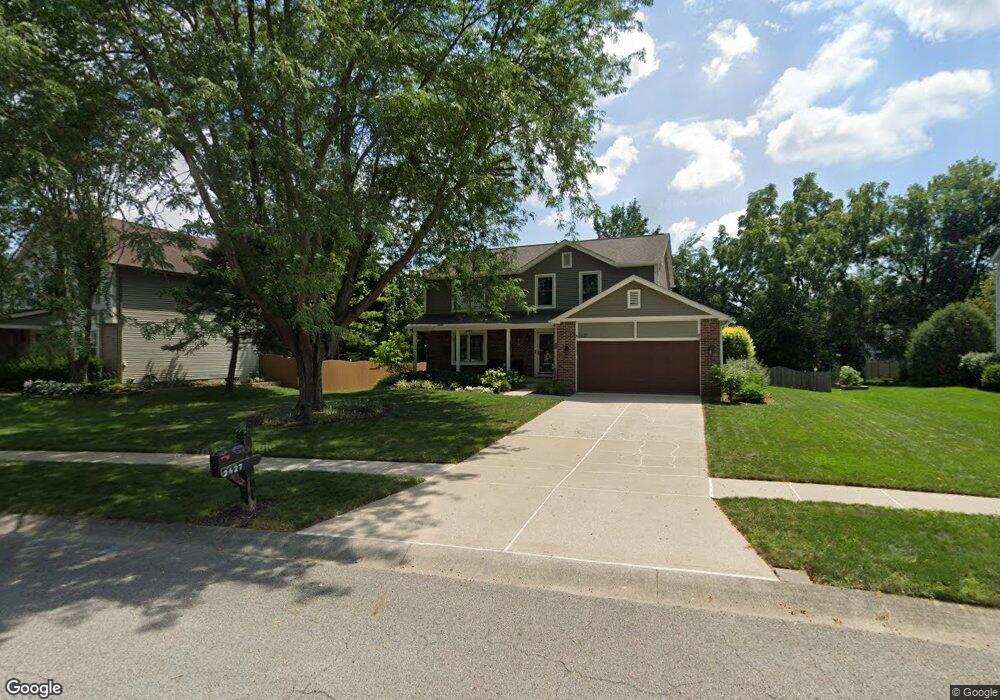
2627 Hoover Crossing Way Grove City, OH 43123
Estimated Value: $396,181 - $457,000
4
Beds
3
Baths
2,030
Sq Ft
$210/Sq Ft
Est. Value
About This Home
This home is located at 2627 Hoover Crossing Way, Grove City, OH 43123 and is currently estimated at $426,795, approximately $210 per square foot. 2627 Hoover Crossing Way is a home located in Franklin County with nearby schools including Hayes Intermediate School, Jc Sommer Elementary School, and Jackson Middle School.
Ownership History
Date
Name
Owned For
Owner Type
Purchase Details
Closed on
Jan 2, 2009
Sold by
Williams Linda S
Bought by
Martin Phillip and Martin Angela A
Current Estimated Value
Home Financials for this Owner
Home Financials are based on the most recent Mortgage that was taken out on this home.
Original Mortgage
$161,197
Outstanding Balance
$106,057
Interest Rate
5.96%
Mortgage Type
FHA
Estimated Equity
$320,738
Purchase Details
Closed on
Oct 27, 1997
Sold by
Grimes Doris L
Bought by
Williams Linda Sue
Purchase Details
Closed on
Oct 3, 1994
Sold by
S A R Const
Bought by
Williams Linda S
Purchase Details
Closed on
Apr 19, 1993
Purchase Details
Closed on
Jan 10, 1992
Create a Home Valuation Report for This Property
The Home Valuation Report is an in-depth analysis detailing your home's value as well as a comparison with similar homes in the area
Home Values in the Area
Average Home Value in this Area
Purchase History
| Date | Buyer | Sale Price | Title Company |
|---|---|---|---|
| Martin Phillip | $173,000 | Talon Group | |
| Williams Linda Sue | -- | -- | |
| Williams Linda S | $138,000 | -- | |
| -- | -- | -- | |
| -- | $46,600 | -- |
Source: Public Records
Mortgage History
| Date | Status | Borrower | Loan Amount |
|---|---|---|---|
| Open | Martin Phillip | $161,197 |
Source: Public Records
Tax History Compared to Growth
Tax History
| Year | Tax Paid | Tax Assessment Tax Assessment Total Assessment is a certain percentage of the fair market value that is determined by local assessors to be the total taxable value of land and additions on the property. | Land | Improvement |
|---|---|---|---|---|
| 2024 | $5,156 | $113,370 | $35,700 | $77,670 |
| 2023 | $5,083 | $113,365 | $35,700 | $77,665 |
| 2022 | $5,357 | $87,850 | $18,900 | $68,950 |
| 2021 | $5,461 | $87,850 | $18,900 | $68,950 |
| 2020 | $5,443 | $87,850 | $18,900 | $68,950 |
| 2019 | $4,935 | $73,890 | $15,750 | $58,140 |
| 2018 | $4,632 | $73,890 | $15,750 | $58,140 |
| 2017 | $4,622 | $73,890 | $15,750 | $58,140 |
| 2016 | $4,346 | $59,960 | $13,970 | $45,990 |
| 2015 | $4,347 | $59,960 | $13,970 | $45,990 |
| 2014 | $4,350 | $59,960 | $13,970 | $45,990 |
| 2013 | $1,955 | $57,085 | $13,300 | $43,785 |
Source: Public Records
Map
Nearby Homes
- 2642 Gardenview Loop
- 4881 Primrose Ct
- 2651 Hoover Crossing Way
- 2618 Vililly Cir W
- 2720 Loris Way
- 0 Hoover Rd
- 2750 Longridge Way
- 2634 Orders Road Ct
- 5124 Keefer Ln
- 5148 Keefer Ln
- 3171 Orders Rd
- 4879 Blossom Way Unit 41
- 4541 Bent Creek Place
- 2395 Cypress Point Rd
- 3022 Crabapple Place Unit 4
- 5232 Hoover Rd
- 2403 White Rd
- 4619 Goodman St
- 2328 Hoover Rd
- 2873 Woodgrove Dr
- 2627 Hoover Crossing Ct
- 2637 Hoover Crossing Ct
- 2617 Hoover Crossing Ct
- 2634 Hoover Crossing Ct
- 2647 Hoover Crossing Ct
- 2607 Hoover Crossing Way
- 2648 Gardenview Loop Unit 33-264
- 2648 Gardenview Loop
- 2622 Hoover Crossing Ct
- 2646 Hoover Crossing Ct
- 2595 Hoover Crossing Way
- 2657 Hoover Crossing Ct
- 2656 Hoover Crossing Ct
- 2657 Hoover Crossing Way
- 2657 Gardenview Loop Unit 45
- 2664 Hanarry Ct
- 2637 Hoover Crossing Way
- 2630 Gardenview Loop Unit 36-263
- 2630 Garden View Loop
- 2643 Gardenview Loop Unit 47-264