NOT LISTED FOR SALE

2627 N Beaton St Corsicana, TX 75110

Estimated Value: $336,000 - $520,000

3 Beds
2 Baths
2,400 Sq Ft
$167/Sq Ft Est. Value

Last Sold October 15, 2020

Current estimated payment $2,677/month

About This Home

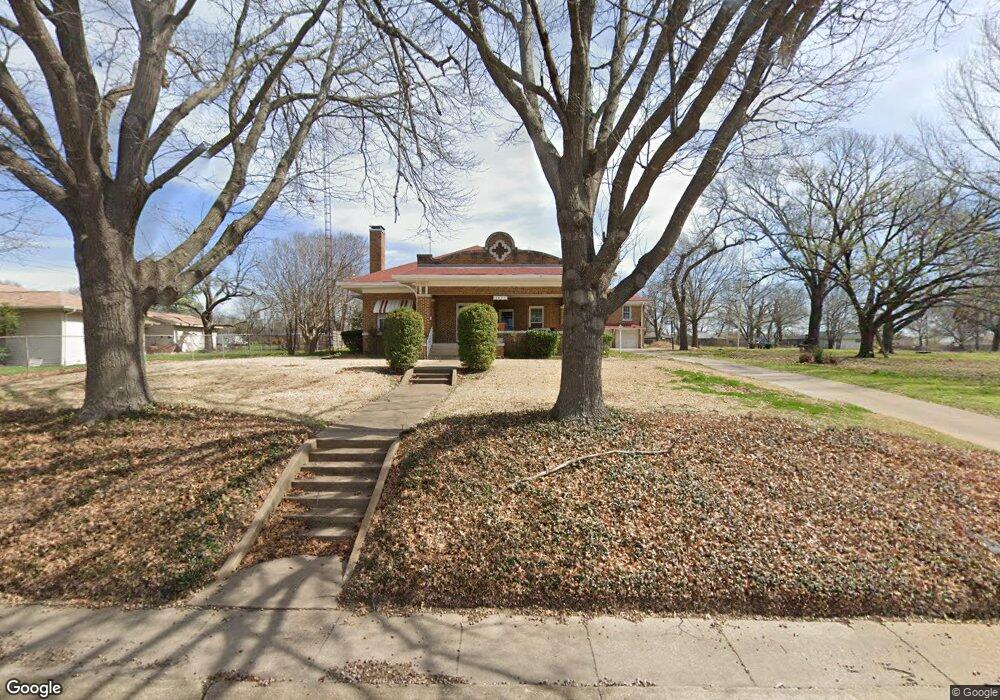
The Lyman T. Davis house is full of charm. 3bed 2bath 2400sq.ft. main house. This almost 100 year old home has many original features: wood flooring, sconces, lots of wood trim, tiles and glass door knobs. This well maintained home has newer roof and energy efficient rooms. Garage apartment is 1200sq.ft. It has lots of potential with bathroom and kitchenette. Large garage with workspace. You'll want to have party after party on the inviting front porch. Don't let this home with a historic past pass you by.

Ownership History

Date Name Owned For Owner Type

Purchase Details

Closed on
Oct 16, 2020
Sold by
Thomerson Markus D and Thomerson Kelli D
Bought by
Rustin Roy N and Hansen Stephanie M
Current Estimated Value
$399,672

Home Financials for this Owner

Home Financials are based on the most recent Mortgage that was taken out on this home.
Original Mortgage
$233,605
Outstanding Balance
$207,309
Interest Rate
2.9%
Mortgage Type
New Conventional
Estimated Equity
$192,363

Purchase Details

Closed on
Aug 11, 2006
Sold by
Slider Peggy Laverne Thomerson and Slider Revocable Living Trust
Bought by
Thomerson Clarence
Source: Public Records

Range of Values:

Collateral Analytics

Collateral Analytics Collateral Analytics AVMs (Automated Valuation Model) employ a number of statistical approaches combined with neighborhood-specific comparable selection guarantees the most up-to-date and precise valuations.

Not Available

Collateral Analytics does not have data for the current month. Please view the chart for historical values.

ICE

ICE Mortgage Technology ICE Mortgage Technology’s AVM (Automated Valuation Model) is a state-of-the-art online residential property valuation tool that provides a quick and accurate estimate of the value of almost any home in the U.S.

Not Available

ICE Mortgage Technology does not have data for the current month. Please view the chart for historical values.

First American

First American First American Data & Analytics’ next-generation AVM combines unrivaled data assets with a blended ensemble of valuation models to produce highly accurate, reliable valuations you can trust.

Not Available

First American does not have data for the current month. Please view the chart for historical values.

Quantarium

Quantarium Quantarium’s valuation service, repeatedly proven the industry’s most accurate and comprehensive, is supercharged with a self-learning and auto-tuning AI engine that continually becomes smarter and more accurate as it processes daily inputs from the industry’s leading RE data lake.

Not Available

Quantarium does not have data for the current month. Please view the chart for historical values.

Average Value
Not Available
List Price
Sold Price
Create a Home Valuation Report for This Property
The Home Valuation Report is an in-depth analysis detailing your home's value as well as a comparison with similar homes in the area

Home Values in the Area

Source: Public Records

Average Home Value in this Area


Source: Public Records

Purchase History

Date Buyer Sale Price Title Company
Rustin Roy N -- Ct
Thomerson Clarence -- None Available
Source: Public Records

Mortgage History

Date Status Borrower Loan Amount
Open Rustin Roy N $233,605
Source: Public Records

Property History

Date Event Price List to Sale Price per Sq Ft Prior Sale
10/15/2020 10/15/20 Sold -- -- -- View Prior Sale
09/01/2020 09/01/20 Pending -- -- --
08/24/2020 08/24/20 For Sale $249,900 -- $104 / Sq Ft

Tax History Compared to Growth

Source: Public Records

Tax History

Year Tax Paid Tax Assessment Tax Assessment Total Assessment is a certain percentage of the fair market value that is determined by local assessors to be the total taxable value of land and additions on the property. Land Improvement
2025 $6,835 $360,989 $175,980 $341,070
2024 $6,214 $328,172 $175,980 $370,300
2023 $5,161 $298,338 $175,980 $364,300
2022 $6,279 $276,470 $21,190 $255,280
2021 $6,409 $246,560 $21,190 $225,370
2020 $3,964 $212,320 $19,570 $192,750
2019 $3,730 $205,350 $19,570 $185,780
2018 $3,391 $205,350 $19,570 $185,780
2017 $3,078 $210,520 $19,570 $190,950
2016 $2,799 $182,610 $19,570 $163,040
2015 -- $183,200 $20,160 $163,040
2014 -- $175,690 $20,160 $155,530
Source: Public Records

Agents Affiliated with this Home

  • Section Image
  • Section Image
See All Agents

Map