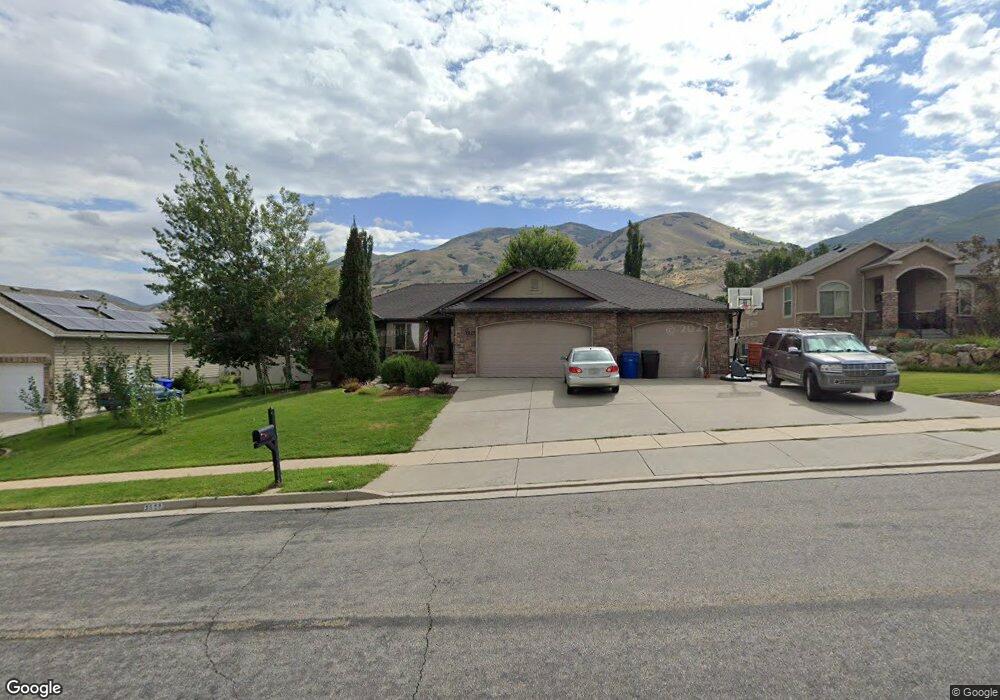
2627 S 775 W Unit 12 Brigham City, UT 84302
Estimated Value: $581,000 - $740,000
--
Bed
--
Bath
1,619
Sq Ft
$392/Sq Ft
Est. Value
About This Home
This home is located at 2627 S 775 W Unit 12, Brigham City, UT 84302 and is currently estimated at $634,597, approximately $391 per square foot. 2627 S 775 W Unit 12 is a home located in Box Elder County with nearby schools including Three Mile Creek School, Adele C. Young Intermediate School, and Box Elder Middle School.
Ownership History
Date
Name
Owned For
Owner Type
Purchase Details
Closed on
Sep 7, 2021
Sold by
Schultz Corey D and Schultz Natalie E
Bought by
Garn Jason and Garn Denai
Current Estimated Value
Home Financials for this Owner
Home Financials are based on the most recent Mortgage that was taken out on this home.
Original Mortgage
$500,000
Outstanding Balance
$453,278
Interest Rate
2.7%
Mortgage Type
New Conventional
Estimated Equity
$181,319
Purchase Details
Closed on
Dec 26, 2007
Sold by
Frahm Jerry E and Frahm Kristin A
Bought by
Schultz Corey D and Schultz Natalie E
Home Financials for this Owner
Home Financials are based on the most recent Mortgage that was taken out on this home.
Original Mortgage
$262,200
Interest Rate
6.21%
Mortgage Type
New Conventional
Purchase Details
Closed on
Sep 13, 2005
Sold by
Perry Hills Llc
Bought by
Frahm Jerry F and Frahm Kristin A
Create a Home Valuation Report for This Property
The Home Valuation Report is an in-depth analysis detailing your home's value as well as a comparison with similar homes in the area
Home Values in the Area
Average Home Value in this Area
Purchase History
| Date | Buyer | Sale Price | Title Company |
|---|---|---|---|
| Garn Jason | -- | Advantage Title Ins Agcy Llc | |
| Schultz Corey D | -- | -- | |
| Frahm Jerry F | -- | None Available |
Source: Public Records
Mortgage History
| Date | Status | Borrower | Loan Amount |
|---|---|---|---|
| Open | Garn Jason | $500,000 | |
| Previous Owner | Schultz Corey D | $262,200 |
Source: Public Records
Tax History Compared to Growth
Tax History
| Year | Tax Paid | Tax Assessment Tax Assessment Total Assessment is a certain percentage of the fair market value that is determined by local assessors to be the total taxable value of land and additions on the property. | Land | Improvement |
|---|---|---|---|---|
| 2025 | $3,554 | $619,960 | $165,000 | $454,960 |
| 2024 | $3,554 | $622,325 | $160,000 | $462,325 |
| 2023 | $3,459 | $640,128 | $160,000 | $480,128 |
| 2022 | $3,318 | $316,109 | $35,750 | $280,359 |
| 2021 | $2,842 | $360,797 | $65,000 | $295,797 |
| 2020 | $2,386 | $360,797 | $65,000 | $295,797 |
| 2019 | $2,358 | $189,619 | $33,000 | $156,619 |
| 2018 | $2,243 | $136,190 | $0 | $136,190 |
| 2017 | $2,337 | $307,619 | $33,000 | $247,619 |
| 2016 | $2,241 | $157,733 | $33,000 | $124,733 |
| 2015 | $2,047 | $146,394 | $33,000 | $113,394 |
| 2014 | $2,047 | $140,994 | $32,010 | $108,984 |
| 2013 | -- | $131,086 | $32,010 | $99,076 |
Source: Public Records
Map
Nearby Homes
- 2548 S 700 W
- 2484 S 900 W
- 2855 S 1000 W
- 2475 S 450 W
- 2925 S Highway 89 Unit 1
- 2925 S Highway 89 Unit 15
- 2925 S Highway 89 Unit 12
- 2975 S 1080 W
- 2277 S 525 W
- 2230 S 635 W Unit C
- 2230 S 635 W Unit D
- 2245 S 450 W
- Northfield Plan at West Meadows
- Everley Plan at West Meadows
- Scottsford Plan at West Meadows
- Pembroke Plan at West Meadows
- Hallwood Plan at West Meadows
- Winfield Plan at West Meadows
- Xavier Plan at West Meadows
- Ravenstone Plan at West Meadows