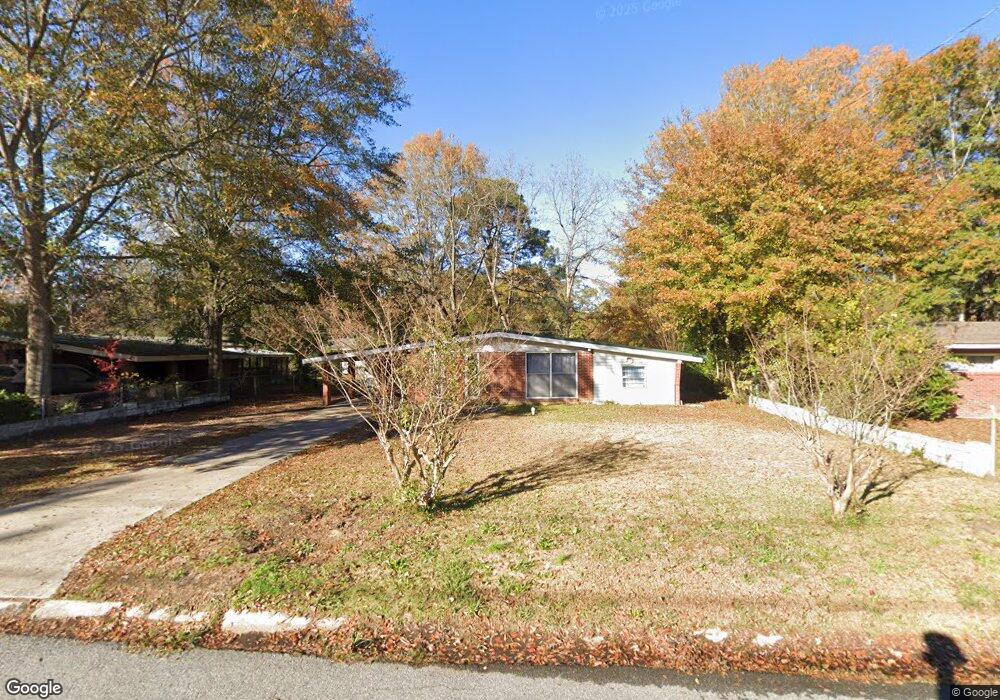
2627 Wise St Columbus, GA 31903
South Columbus NeighborhoodEstimated Value: $93,142 - $111,000
3
Beds
2
Baths
1,304
Sq Ft
$80/Sq Ft
Est. Value
About This Home
This home is located at 2627 Wise St, Columbus, GA 31903 and is currently estimated at $103,786, approximately $79 per square foot. 2627 Wise St is a home located in Muscogee County with nearby schools including Key Elementary School, Eddy Middle School, and Spencer High School.
Ownership History
Date
Name
Owned For
Owner Type
Purchase Details
Closed on
Jul 30, 2010
Sold by
Secretary Of Veterans Affairs
Bought by
Turman Frank A and Turman Edna E
Current Estimated Value
Purchase Details
Closed on
Feb 2, 2010
Sold by
Suntrust Mortgage Inc
Bought by
Secretary Of Veterans Affairs
Purchase Details
Closed on
Feb 12, 2007
Sold by
Homeward Bound Lending Llc
Bought by
Montgomery Robby J
Home Financials for this Owner
Home Financials are based on the most recent Mortgage that was taken out on this home.
Original Mortgage
$90,402
Interest Rate
6.08%
Mortgage Type
VA
Purchase Details
Closed on
Jan 5, 2007
Sold by
Brown Alonzo L
Bought by
Homeward Bound Lending Llc
Home Financials for this Owner
Home Financials are based on the most recent Mortgage that was taken out on this home.
Original Mortgage
$90,402
Interest Rate
6.08%
Mortgage Type
VA
Create a Home Valuation Report for This Property
The Home Valuation Report is an in-depth analysis detailing your home's value as well as a comparison with similar homes in the area
Home Values in the Area
Average Home Value in this Area
Purchase History
| Date | Buyer | Sale Price | Title Company |
|---|---|---|---|
| Turman Frank A | -- | None Available | |
| Secretary Of Veterans Affairs | -- | None Available | |
| Suntrust Mortgage Inc | $30,845 | None Available | |
| Montgomery Robby J | $88,500 | None Available | |
| Homeward Bound Lending Llc | -- | None Available |
Source: Public Records
Mortgage History
| Date | Status | Borrower | Loan Amount |
|---|---|---|---|
| Previous Owner | Montgomery Robby J | $90,402 |
Source: Public Records
Tax History
| Year | Tax Paid | Tax Assessment Tax Assessment Total Assessment is a certain percentage of the fair market value that is determined by local assessors to be the total taxable value of land and additions on the property. | Land | Improvement |
|---|---|---|---|---|
| 2025 | $1,176 | $30,036 | $4,212 | $25,824 |
| 2024 | $1,176 | $30,036 | $4,212 | $25,824 |
| 2023 | $1,183 | $30,036 | $4,212 | $25,824 |
| 2022 | $985 | $24,132 | $4,212 | $19,920 |
| 2021 | $920 | $22,540 | $4,212 | $18,328 |
| 2020 | $921 | $22,540 | $4,212 | $18,328 |
| 2019 | $923 | $22,540 | $4,212 | $18,328 |
| 2018 | $923 | $22,540 | $4,212 | $18,328 |
| 2017 | $926 | $22,540 | $4,212 | $18,328 |
| 2016 | $1,329 | $32,227 | $3,600 | $28,627 |
| 2015 | $1,331 | $32,227 | $3,600 | $28,627 |
| 2014 | $1,333 | $32,227 | $3,600 | $28,627 |
| 2013 | -- | $32,227 | $3,600 | $28,627 |
Source: Public Records
Map
Nearby Homes
- 2720 Broadmoor Dr
- 2720 Wise St
- 2309 Ginny Ave
- 2608 Walker St
- 2611 Rice St
- 2450 Cornell Ave
- 2846 Walker St
- 2550 Cornell Ave
- 2425 Howe Ave
- 2940 Walker St
- 2940 Blan St
- 3044 Wise St
- 3048 Knox St
- 3015 Hendrix St
- 3063 Meade St
- 3018 Plantation Rd
- 2102 Somerset Ave
- 2404 Bruce Ave
- 2333 Bruce Ave
- 2058 Somerset Ave
Your Personal Tour Guide
Ask me questions while you tour the home.