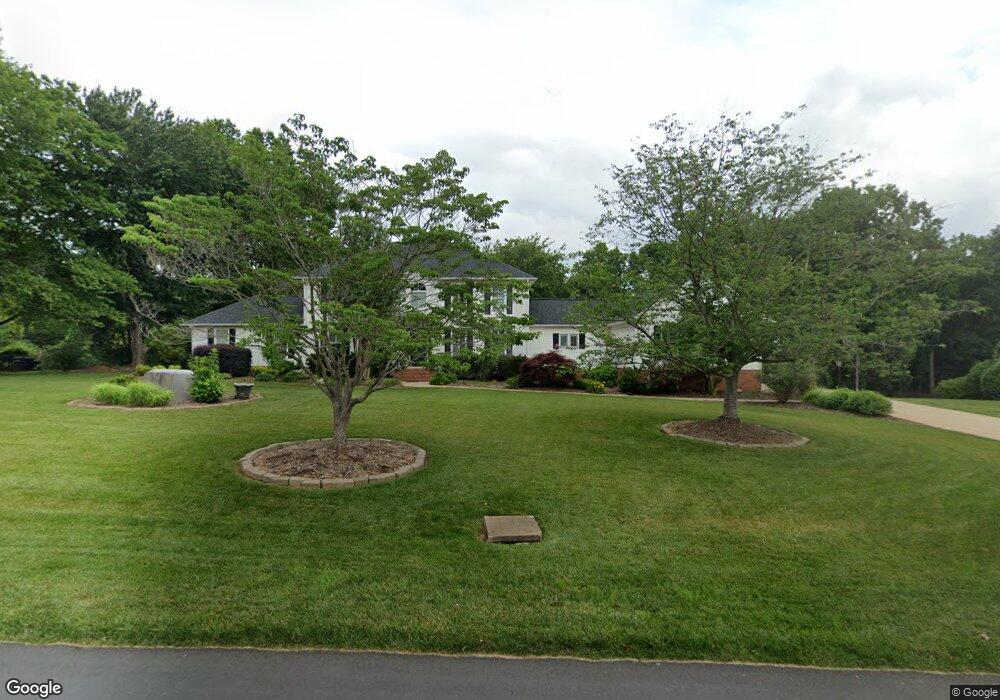
2628 Fines Creek Dr Statesville, NC 28625
Estimated Value: $580,000 - $902,000
4
Beds
5
Baths
5,111
Sq Ft
$135/Sq Ft
Est. Value
About This Home
This home is located at 2628 Fines Creek Dr, Statesville, NC 28625 and is currently estimated at $689,176, approximately $134 per square foot. 2628 Fines Creek Dr is a home located in Iredell County with nearby schools including East Iredell Elementary School, East Iredell Middle School, and Statesville High School.
Ownership History
Date
Name
Owned For
Owner Type
Purchase Details
Closed on
Jan 31, 2013
Sold by
Petrozza Joseph A and Petrozza Lisa H
Bought by
Buckner Hannah P and May Bernard J
Current Estimated Value
Home Financials for this Owner
Home Financials are based on the most recent Mortgage that was taken out on this home.
Original Mortgage
$346,500
Outstanding Balance
$241,999
Interest Rate
3.39%
Mortgage Type
New Conventional
Estimated Equity
$447,177
Purchase Details
Closed on
Mar 30, 2000
Sold by
Wallace Patton Suzanne and Wallace Bruce
Bought by
Petrozza Joseph A and Petrozza Lisa H
Home Financials for this Owner
Home Financials are based on the most recent Mortgage that was taken out on this home.
Original Mortgage
$247,500
Interest Rate
7%
Purchase Details
Closed on
Jul 1, 1995
Purchase Details
Closed on
May 1, 1990
Purchase Details
Closed on
Sep 1, 1983
Create a Home Valuation Report for This Property
The Home Valuation Report is an in-depth analysis detailing your home's value as well as a comparison with similar homes in the area
Home Values in the Area
Average Home Value in this Area
Purchase History
| Date | Buyer | Sale Price | Title Company |
|---|---|---|---|
| Buckner Hannah P | $385,000 | None Available | |
| Petrozza Joseph A | $275,000 | -- | |
| -- | $246,000 | -- | |
| -- | $25,000 | -- | |
| -- | $9,500 | -- |
Source: Public Records
Mortgage History
| Date | Status | Borrower | Loan Amount |
|---|---|---|---|
| Open | Buckner Hannah P | $346,500 | |
| Previous Owner | Petrozza Joseph A | $247,500 |
Source: Public Records
Tax History Compared to Growth
Tax History
| Year | Tax Paid | Tax Assessment Tax Assessment Total Assessment is a certain percentage of the fair market value that is determined by local assessors to be the total taxable value of land and additions on the property. | Land | Improvement |
|---|---|---|---|---|
| 2024 | $5,273 | $512,260 | $60,000 | $452,260 |
| 2023 | $5,273 | $512,260 | $60,000 | $452,260 |
| 2022 | $4,676 | $419,760 | $30,000 | $389,760 |
| 2021 | $4,732 | $419,760 | $30,000 | $389,760 |
| 2020 | $4,732 | $419,760 | $30,000 | $389,760 |
| 2019 | $4,690 | $419,760 | $30,000 | $389,760 |
| 2018 | $4,052 | $384,670 | $30,000 | $354,670 |
| 2017 | $3,971 | $384,670 | $30,000 | $354,670 |
| 2016 | $3,971 | $384,670 | $30,000 | $354,670 |
| 2015 | $3,658 | $384,670 | $30,000 | $354,670 |
| 2014 | $3,334 | $366,680 | $27,500 | $339,180 |
Source: Public Records
Map
Nearby Homes
- 415 N Greenbriar Rd
- 324 Gaston Ct
- 104 Trissy Ct
- 2680 Andes Dr
- 3010 Eastway Dr
- 234 Edgewood Dr
- 126 Dyssa Loop
- 144 Dyssa Loop
- 139 Trillium Dr
- 2756 Peachtree Rd
- 220 Augusta Dr
- 206 White Apple Way
- 2752 Peachtree Rd
- 383 Hollingswood Dr
- 428 Florence Cir
- 2680 Peachtree Rd
- 517 Augusta Dr
- 2231 Ballingarry Dr
- 219 E Glen Eagles Rd
- 251 Gleneagles Rd E
- 2630 Fines Creek Dr
- 2624 Fines Creek Dr
- 0 Greenberry Ln Unit Lot 13
- 2629 Fines Creek Dr
- 2622 Fines Creek Dr
- 2632 Fines Creek Dr
- 2621 Fines Creek Dr
- 147 Eastwood Dr
- 2637 Fines Creek Dr Unit 17
- 155 Eastwood Dr
- 605 Greenberry Ln
- 2620 Fines Creek Dr
- 606 Greenberry Ln
- 2634 Fines Creek Dr
- 165 Eastwood Dr
- 143 Eastwood Dr Unit 24
- 2617 Fines Creek Dr
- 160 Eastwood Dr
- 2618 Fines Creek Dr
- 164 Eastwood Dr