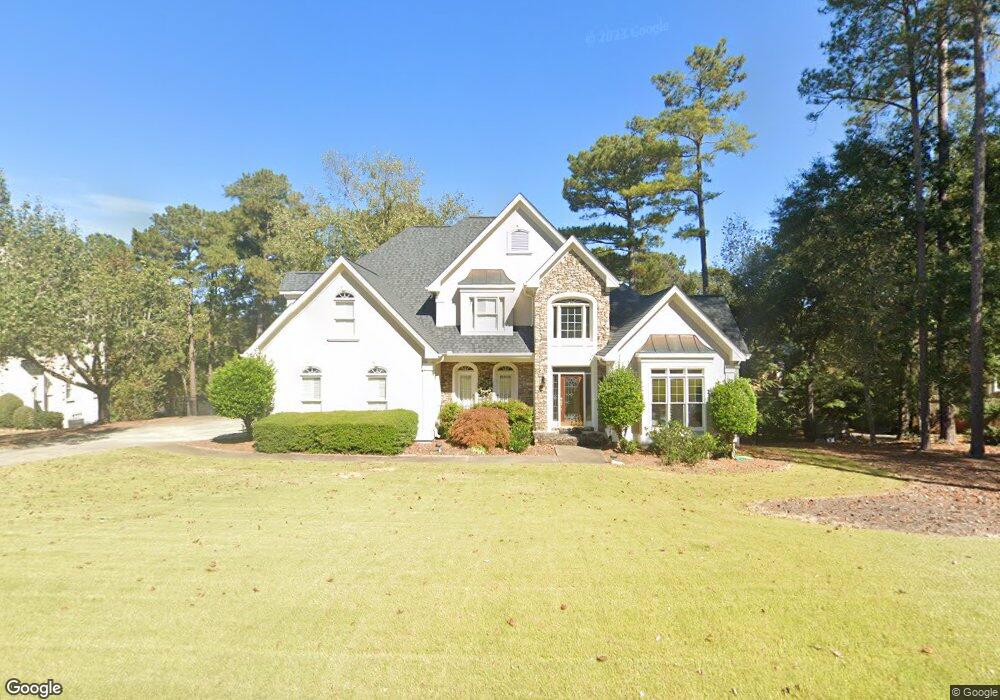
2628 High St SW Unit 2 Conyers, GA 30094
Estimated Value: $468,602 - $592,000
4
Beds
4
Baths
3,329
Sq Ft
$157/Sq Ft
Est. Value
About This Home
This home is located at 2628 High St SW Unit 2, Conyers, GA 30094 and is currently estimated at $524,151, approximately $157 per square foot. 2628 High St SW Unit 2 is a home located in Rockdale County with nearby schools including Sims Elementary School, Edwards Middle School, and Heritage High School.
Ownership History
Date
Name
Owned For
Owner Type
Purchase Details
Closed on
Dec 18, 2001
Sold by
French Horace E and French Patricia L
Bought by
Creager Robert R and Creager Cathy S
Current Estimated Value
Home Financials for this Owner
Home Financials are based on the most recent Mortgage that was taken out on this home.
Original Mortgage
$300,700
Outstanding Balance
$128,394
Interest Rate
6.42%
Mortgage Type
New Conventional
Estimated Equity
$395,757
Purchase Details
Closed on
Oct 13, 1998
Sold by
French Horace E and French Patricia L
Bought by
French Horacee E and French Patricia
Purchase Details
Closed on
Jun 23, 1997
Sold by
D Edward Young Const Inc
Bought by
French Horace E and French Patricia L
Home Financials for this Owner
Home Financials are based on the most recent Mortgage that was taken out on this home.
Original Mortgage
$190,000
Interest Rate
7.92%
Mortgage Type
New Conventional
Create a Home Valuation Report for This Property
The Home Valuation Report is an in-depth analysis detailing your home's value as well as a comparison with similar homes in the area
Home Values in the Area
Average Home Value in this Area
Purchase History
| Date | Buyer | Sale Price | Title Company |
|---|---|---|---|
| Creager Robert R | $385,000 | -- | |
| French Horacee E | -- | -- | |
| French Horace E | $348,500 | -- |
Source: Public Records
Mortgage History
| Date | Status | Borrower | Loan Amount |
|---|---|---|---|
| Open | Creager Robert R | $300,700 | |
| Previous Owner | French Horace E | $190,000 |
Source: Public Records
Tax History Compared to Growth
Tax History
| Year | Tax Paid | Tax Assessment Tax Assessment Total Assessment is a certain percentage of the fair market value that is determined by local assessors to be the total taxable value of land and additions on the property. | Land | Improvement |
|---|---|---|---|---|
| 2024 | $4,593 | $209,000 | $73,040 | $135,960 |
| 2023 | $3,643 | $180,200 | $49,000 | $131,200 |
| 2022 | $2,852 | $137,120 | $38,480 | $98,640 |
| 2021 | $3,056 | $137,120 | $38,480 | $98,640 |
| 2020 | $2,959 | $129,240 | $38,840 | $90,400 |
| 2019 | $2,632 | $115,880 | $25,480 | $90,400 |
| 2018 | $2,534 | $112,200 | $24,400 | $87,800 |
| 2017 | $2,905 | $106,840 | $25,480 | $81,360 |
| 2016 | $2,585 | $103,480 | $22,120 | $81,360 |
| 2015 | $2,590 | $103,480 | $22,120 | $81,360 |
| 2014 | $2,340 | $104,560 | $22,120 | $82,440 |
| 2013 | -- | $118,080 | $27,480 | $90,600 |
Source: Public Records
Map
Nearby Homes
- 2329 Lochinver Ln SW
- 3412 Kinsley Ct
- 2325 Lochinver Ln SW
- 3009 Inverness Ct
- 2315 Lochinver Ln SW
- 2150 Smyrna Ridge Ct SW
- 2203 Liberty Ln SW Unit 2
- 2305 Lochinver Ln SW
- 2704 Forest Park Ct Unit 1
- 2352 Highway 138 SW
- 2956 Loch Lomond Dr
- 2340 New Haven Place Unit 3
- 1993 Old Smyrna Rd SW
- 2402 Highway 138 SW
- 2055 Smyrna Rd SW
- 325 Yukon Dr Unit 66
- 335 Yukon Dr Unit 61
- 341 Yukon Dr Unit 58
- 2630 High St SW
- 2626 High St SW
- 2624 High St SW Unit 18C
- 2624 High St SW
- 2632 High St SW
- 2633 High St SW
- 2631 High St SW
- 2622 High St SW
- 2629 High St SW
- 2635 High St SW
- 2634 High St SW
- 2623 High St SW Unit 2
- 2627 High St SW Unit 2
- 2620 High St SW
- 2621 High St SW
- 2637 High St SW Unit 2
- 2636 High St SW
- 3323 Flat Stone Ct
- 3327 Flat Stone Ct
- 3319 Flat Stone Ct