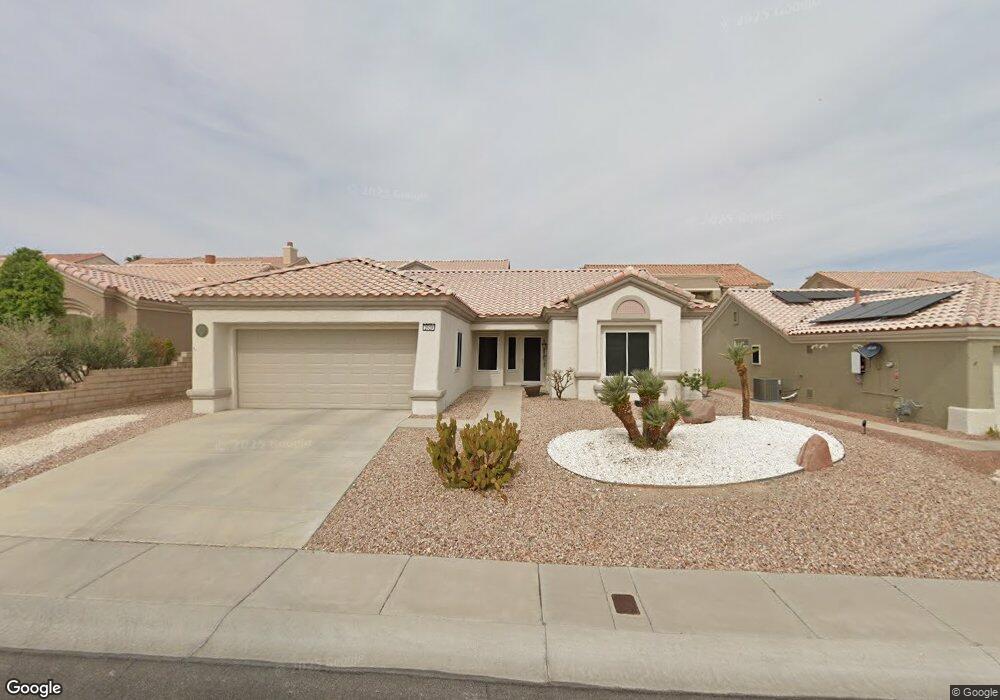
2629 Byron Dr Las Vegas, NV 89134
Sun City Summerlin NeighborhoodEstimated Value: $467,000 - $532,000
2
Beds
2
Baths
1,533
Sq Ft
$322/Sq Ft
Est. Value
About This Home
This home is located at 2629 Byron Dr, Las Vegas, NV 89134 and is currently estimated at $494,295, approximately $322 per square foot. 2629 Byron Dr is a home located in Clark County with nearby schools including William Lummis Elementary School, Ernest Becker Middle School, and Palo Verde High School.
Ownership History
Date
Name
Owned For
Owner Type
Purchase Details
Closed on
Dec 6, 2012
Sold by
Pulling Kathleen Ann
Bought by
Pulling Kathleen Ann
Current Estimated Value
Purchase Details
Closed on
Jan 23, 2001
Sold by
Young Kenneth R and Young Roberta
Bought by
Pulling Fred B and Pulling Anna W
Purchase Details
Closed on
Jun 10, 1999
Sold by
Fadem Alan and Fadem Harriet
Bought by
Young Kenneth R and Young Roberta
Home Financials for this Owner
Home Financials are based on the most recent Mortgage that was taken out on this home.
Original Mortgage
$142,400
Interest Rate
7.01%
Purchase Details
Closed on
Jan 19, 1999
Sold by
Fadem Alan and Fadem Harriet
Bought by
Fadem Alan and Fadem Harriet
Purchase Details
Closed on
May 27, 1994
Sold by
Del Webb Communities Inc
Bought by
Fadem Alan and Fadem Harriet H
Home Financials for this Owner
Home Financials are based on the most recent Mortgage that was taken out on this home.
Original Mortgage
$104,350
Interest Rate
6%
Create a Home Valuation Report for This Property
The Home Valuation Report is an in-depth analysis detailing your home's value as well as a comparison with similar homes in the area
Home Values in the Area
Average Home Value in this Area
Purchase History
| Date | Buyer | Sale Price | Title Company |
|---|---|---|---|
| Pulling Kathleen Ann | $155,000 | Lawyers Title Of Nevada Hen | |
| Pulling Fred B | $195,000 | Old Republic Title Company | |
| Young Kenneth R | $178,000 | First American Title Co | |
| Fadem Alan | -- | -- | |
| Fadem Alan | $151,500 | First American Title Company |
Source: Public Records
Mortgage History
| Date | Status | Borrower | Loan Amount |
|---|---|---|---|
| Previous Owner | Young Kenneth R | $142,400 | |
| Previous Owner | Fadem Alan | $104,350 |
Source: Public Records
Tax History Compared to Growth
Tax History
| Year | Tax Paid | Tax Assessment Tax Assessment Total Assessment is a certain percentage of the fair market value that is determined by local assessors to be the total taxable value of land and additions on the property. | Land | Improvement |
|---|---|---|---|---|
| 2025 | $3,025 | $103,887 | $43,400 | $60,487 |
| 2024 | $2,802 | $103,887 | $43,400 | $60,487 |
| 2023 | $2,802 | $92,675 | $35,000 | $57,675 |
| 2022 | $2,594 | $88,027 | $35,000 | $53,027 |
| 2021 | $2,402 | $79,265 | $28,700 | $50,565 |
| 2020 | $2,228 | $78,901 | $28,700 | $50,201 |
| 2019 | $2,088 | $73,831 | $24,150 | $49,681 |
| 2018 | $1,992 | $68,457 | $20,300 | $48,157 |
| 2017 | $1,865 | $66,399 | $18,200 | $48,199 |
| 2016 | $1,865 | $64,538 | $16,100 | $48,438 |
| 2015 | $1,861 | $61,221 | $13,300 | $47,921 |
| 2014 | $1,803 | $57,152 | $11,550 | $45,602 |
Source: Public Records
Map
Nearby Homes
- 2624 Spalding Dr
- 10144 Hunter Springs Dr
- 10025 Netherton Dr
- 10036 Keysborough Dr
- 2725 Byron Dr
- 2801 Byron Dr
- 10009 Netherton Dr
- 2616 High Range Dr
- 2505 Rocky Plains Dr
- 10017 Bundella Dr Unit 34
- 2513 Dark Peak Dr
- 2712 Herons Creek Dr
- 10409 Shoalhaven Dr
- 10012 Bundella Dr
- 2540 Youngdale Dr
- 10013 Cresent Creek Dr
- 9948 Bundella Dr
- 2601 Lotus Hill Dr
- 3001 Swan Hill Dr
- 10009 Hemet Dr
- 2625 Byron Dr
- 2701 Byron Dr
- 2700 Spalding Dr
- 2704 Spalding Dr
- 2621 Byron Dr
- 2705 Byron Dr
- 10113 Keysborough Dr
- 2708 Spalding Dr
- 10112 Keysborough Dr
- 2617 Byron Dr
- 2709 Byron Dr
- 10124 Hope Island Dr
- 2620 Spalding Dr
- 10109 Keysborough Dr
- 2712 Spalding Dr
- 10108 Keysborough Dr
- 10045 Netherton Dr
- 10120 Hope Island Dr
- 2613 Byron Dr
- 2705 Spalding Dr