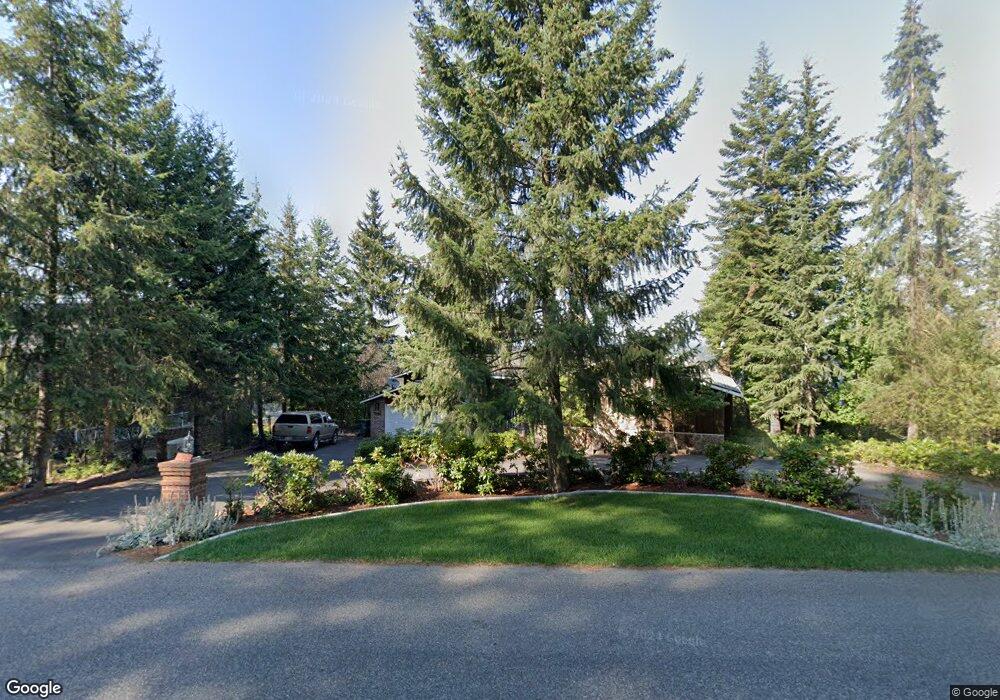
2629 E Hayden View Dr Coeur D Alene, ID 83815
Estimated Value: $996,000 - $1,119,000
4
Beds
4
Baths
3,352
Sq Ft
$310/Sq Ft
Est. Value
About This Home
This home is located at 2629 E Hayden View Dr, Coeur D Alene, ID 83815 and is currently estimated at $1,037,739, approximately $309 per square foot. 2629 E Hayden View Dr is a home with nearby schools including Dalton Elementary School, Canfield Middle School, and Coeur d'Alene High School.
Ownership History
Date
Name
Owned For
Owner Type
Purchase Details
Closed on
Feb 8, 2023
Sold by
Leupp Richard P and Leupp Margaret A
Bought by
Richard And Margaret Leupp Family Trust
Current Estimated Value
Purchase Details
Closed on
Nov 4, 2010
Sold by
Mayer Stephen Paul and Mayer Dee
Bought by
Leupp Richard P and Leupp Margaret L
Purchase Details
Closed on
Jun 14, 2007
Sold by
Us Bank National Assn
Bought by
Stephen Paul & Dee Mayer Family Trust
Purchase Details
Closed on
Jan 12, 2007
Sold by
Basile Kathryn B and Basile August J
Bought by
Us Bank National Association
Purchase Details
Closed on
May 31, 2005
Sold by
Milloy Gwendolyn A and Elichner Laura L
Bought by
Basile Kathryn B and Basile August J
Home Financials for this Owner
Home Financials are based on the most recent Mortgage that was taken out on this home.
Original Mortgage
$392,000
Interest Rate
6.5%
Mortgage Type
Adjustable Rate Mortgage/ARM
Create a Home Valuation Report for This Property
The Home Valuation Report is an in-depth analysis detailing your home's value as well as a comparison with similar homes in the area
Home Values in the Area
Average Home Value in this Area
Purchase History
| Date | Buyer | Sale Price | Title Company |
|---|---|---|---|
| Richard And Margaret Leupp Family Trust | -- | -- | |
| Leupp Richard P | -- | -- | |
| Stephen Paul & Dee Mayer Family Trust | -- | -- | |
| Us Bank National Association | $411,052 | -- | |
| Basile Kathryn B | -- | -- |
Source: Public Records
Mortgage History
| Date | Status | Borrower | Loan Amount |
|---|---|---|---|
| Previous Owner | Basile Kathryn B | $392,000 |
Source: Public Records
Tax History Compared to Growth
Tax History
| Year | Tax Paid | Tax Assessment Tax Assessment Total Assessment is a certain percentage of the fair market value that is determined by local assessors to be the total taxable value of land and additions on the property. | Land | Improvement |
|---|---|---|---|---|
| 2024 | $2,504 | $821,420 | $370,000 | $451,420 |
| 2023 | $2,504 | $969,761 | $410,000 | $559,761 |
| 2022 | $3,475 | $1,021,846 | $435,000 | $586,846 |
| 2021 | $3,137 | $617,601 | $265,000 | $352,601 |
| 2020 | $3,442 | $584,060 | $312,500 | $271,560 |
| 2019 | $3,239 | $517,667 | $250,000 | $267,667 |
| 2018 | $3,311 | $482,840 | $250,800 | $232,040 |
| 2017 | $3,611 | $490,660 | $264,000 | $226,660 |
| 2016 | $3,468 | $454,660 | $240,000 | $214,660 |
| 2015 | $3,215 | $414,731 | $227,601 | $187,130 |
| 2013 | $1,461 | $358,490 | $188,100 | $170,390 |
Source: Public Records
Map
Nearby Homes
- 2304 E Grandview Dr
- 2326 E Summit Dr
- 3139 E Hayden View Dr
- 2735 E Packsaddle Dr
- 2699 E Packsaddle Dr
- 2177 E Grandview Dr
- 2735 E Spyglass Ct
- 3163 E Lookout Dr
- 2010 E Grandview Dr
- 1985 E Grandview Dr
- 2175 E Packsaddle Dr
- NKA E Sundown Dr
- 2060 E Woodstone Dr
- 1692 E Pebblestone Ct
- 2076 E Sundown Dr
- 3669 E Lookout Dr
- 8385 N Selkirk Ct
- 1280 Glenmore Ct
- 7728 N 15th St
- NNA E Lookout Dr
- 2659 E Hayden View Dr
- 2623 E Hayden View Dr
- East Upper Hayden Lake Rd Lt 126
- 2412 E Upper Hayden Lake Rd
- 2424 E Upper Hayden Lake Rd
- 2396 E Upper Hayden Lake Rd
- 2559 E Hayden View Dr
- 2618 E Hayden View Dr
- 2450 E Upper Hayden Lake Rd
- 2423 E Upper Hayden Lake Rd
- 2360 E Upper Hayden Lake Rd
- 2462 E Upper Hayden Lake Rd
- 2680 E Hayden View Dr
- 2765 E Hayden View Dr
- 2529 E Hayden View Dr
- 2532 E Upper Hayden Lake Rd
- 0 Lower Hayden Lake Unit 6-1216
- 0 Lower Hayden Lake Unit 98-2049
- 0 Lower Hayden Lake Unit 97-3955
- 0 Lower Hayden Lake Unit 97-1609