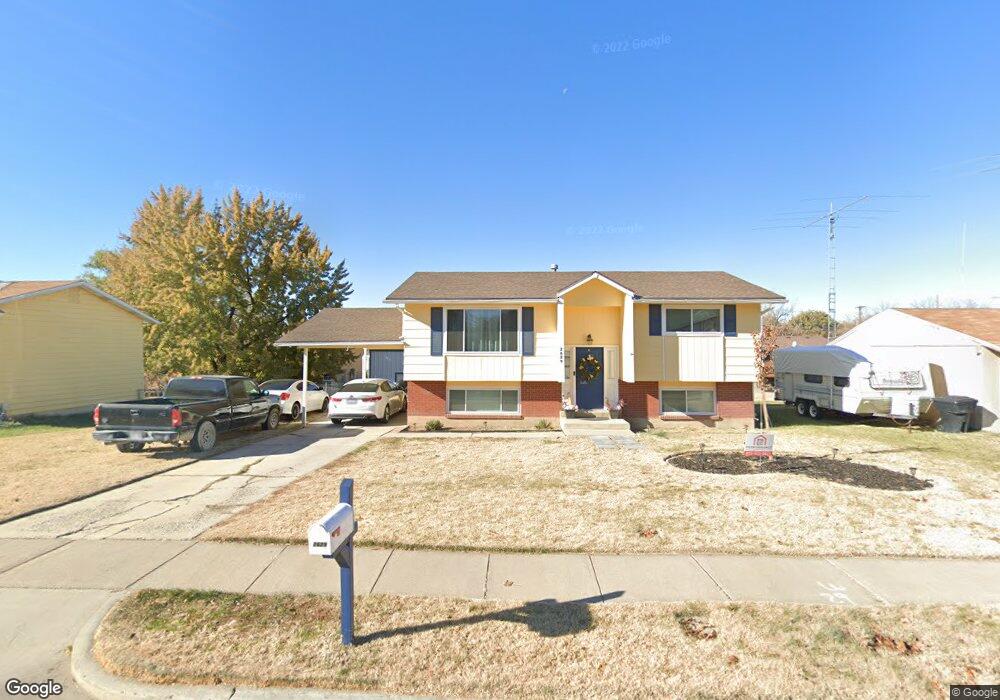
2629 N 950 W Clearfield, UT 84015
Estimated Value: $393,000 - $465,000
5
Beds
1
Bath
1,886
Sq Ft
$219/Sq Ft
Est. Value
About This Home
This home is located at 2629 N 950 W, Clearfield, UT 84015 and is currently estimated at $413,903, approximately $219 per square foot. 2629 N 950 W is a home located in Davis County with nearby schools including Fremont School, Sunset Junior High School, and Northridge High School.
Ownership History
Date
Name
Owned For
Owner Type
Purchase Details
Closed on
Feb 9, 2021
Sold by
Ante Daniel
Bought by
Ante Daniel and Ante Karma
Current Estimated Value
Purchase Details
Closed on
Jun 26, 2020
Sold by
Blanton Amanda L
Bought by
Ante Daniel
Home Financials for this Owner
Home Financials are based on the most recent Mortgage that was taken out on this home.
Original Mortgage
$263,145
Outstanding Balance
$233,258
Interest Rate
3.2%
Mortgage Type
FHA
Estimated Equity
$180,645
Purchase Details
Closed on
Jul 7, 2016
Sold by
Feldman Scott N
Bought by
Blanton Amanda L
Purchase Details
Closed on
May 20, 2011
Sold by
Feldman Scott
Bought by
Feldman Jody
Purchase Details
Closed on
Sep 12, 2007
Sold by
Feldman Scott
Bought by
Feldman Scott and Feldman Jody
Home Financials for this Owner
Home Financials are based on the most recent Mortgage that was taken out on this home.
Original Mortgage
$159,100
Interest Rate
6.67%
Mortgage Type
Purchase Money Mortgage
Create a Home Valuation Report for This Property
The Home Valuation Report is an in-depth analysis detailing your home's value as well as a comparison with similar homes in the area
Home Values in the Area
Average Home Value in this Area
Purchase History
| Date | Buyer | Sale Price | Title Company |
|---|---|---|---|
| Ante Daniel | -- | Accommodation | |
| Ante Daniel | -- | Title Guarantee Layton | |
| Blanton Amanda L | -- | Inwest Title | |
| Feldman Jody | -- | Inwest Title | |
| Feldman Scott | -- | Accommodation | |
| Feldman Scott N | -- | First American Title |
Source: Public Records
Mortgage History
| Date | Status | Borrower | Loan Amount |
|---|---|---|---|
| Open | Ante Daniel | $263,145 | |
| Previous Owner | Feldman Scott N | $159,100 |
Source: Public Records
Tax History
| Year | Tax Paid | Tax Assessment Tax Assessment Total Assessment is a certain percentage of the fair market value that is determined by local assessors to be the total taxable value of land and additions on the property. | Land | Improvement |
|---|---|---|---|---|
| 2025 | $1,962 | $188,650 | $87,890 | $100,760 |
| 2024 | $1,929 | $186,451 | $96,861 | $89,590 |
| 2023 | $1,778 | $318,000 | $109,763 | $208,237 |
| 2022 | $1,862 | $184,250 | $67,682 | $116,568 |
| 2021 | $1,697 | $249,000 | $83,818 | $165,182 |
| 2020 | $1,460 | $212,000 | $70,741 | $141,259 |
| 2019 | $1,424 | $202,000 | $83,558 | $118,442 |
| 2018 | $1,341 | $187,000 | $70,693 | $116,307 |
| 2016 | $1,217 | $87,615 | $27,427 | $60,188 |
| 2015 | $1,182 | $80,905 | $27,427 | $53,478 |
| 2014 | $1,188 | $82,574 | $27,427 | $55,147 |
| 2013 | -- | $74,264 | $25,230 | $49,034 |
Source: Public Records
Map
Nearby Homes
Your Personal Tour Guide
Ask me questions while you tour the home.