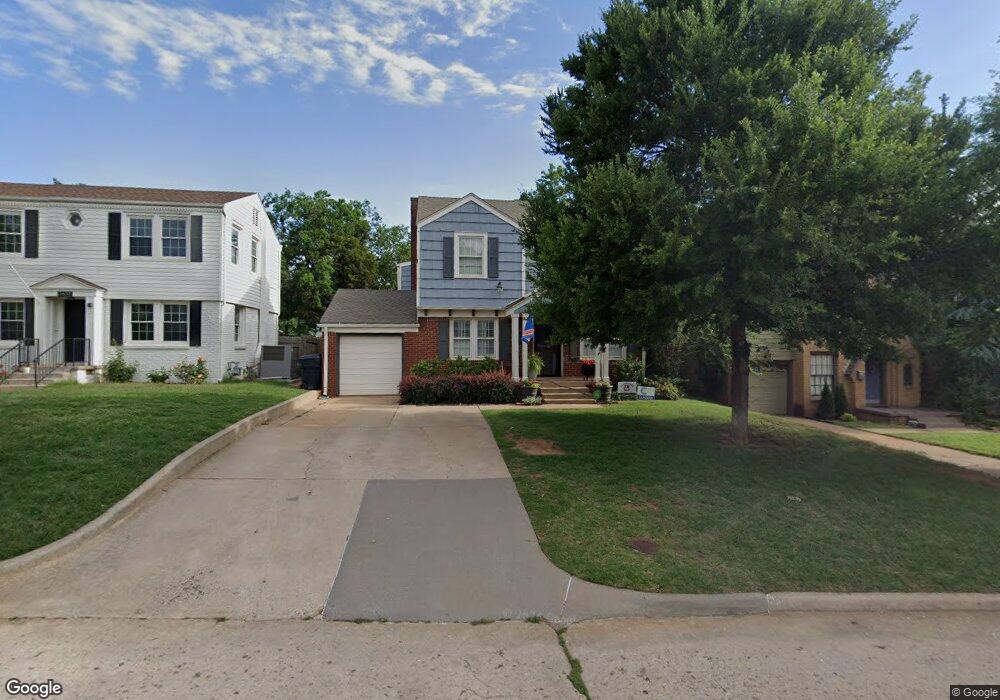
2629 NW 26th St Oklahoma City, OK 73107
Cleveland UCD NeighborhoodEstimated Value: $320,000 - $404,000
4
Beds
3
Baths
2,659
Sq Ft
$137/Sq Ft
Est. Value
About This Home
This home is located at 2629 NW 26th St, Oklahoma City, OK 73107 and is currently estimated at $365,419, approximately $137 per square foot. 2629 NW 26th St is a home located in Oklahoma County with nearby schools including Cleveland Elementary School, Taft Middle School, and Northwest Classen High School.
Ownership History
Date
Name
Owned For
Owner Type
Purchase Details
Closed on
Jun 1, 2020
Sold by
Smith Brian K and Smith Dorothy T
Bought by
Smith Brian Kendall and Smith Dorothy Inez
Current Estimated Value
Home Financials for this Owner
Home Financials are based on the most recent Mortgage that was taken out on this home.
Original Mortgage
$228,600
Outstanding Balance
$182,323
Interest Rate
3.3%
Mortgage Type
New Conventional
Estimated Equity
$183,096
Purchase Details
Closed on
May 12, 2010
Sold by
Moon Kenneth C and Moon Jane M
Bought by
Smith Jacob M and Smith Lexi J
Home Financials for this Owner
Home Financials are based on the most recent Mortgage that was taken out on this home.
Original Mortgage
$180,568
Interest Rate
5.25%
Mortgage Type
FHA
Purchase Details
Closed on
Aug 28, 1998
Sold by
Hagan James Colby and Hagan Brenda
Bought by
Moon Kenneth C and Moon Jane M
Create a Home Valuation Report for This Property
The Home Valuation Report is an in-depth analysis detailing your home's value as well as a comparison with similar homes in the area
Home Values in the Area
Average Home Value in this Area
Purchase History
| Date | Buyer | Sale Price | Title Company |
|---|---|---|---|
| Smith Brian Kendall | -- | None Available | |
| Smith Jacob M | $183,000 | Stewart Abstract & Title Of | |
| Moon Kenneth C | $107,000 | First Amer Title & Trust Co |
Source: Public Records
Mortgage History
| Date | Status | Borrower | Loan Amount |
|---|---|---|---|
| Open | Smith Brian Kendall | $228,600 | |
| Closed | Smith Jacob M | $180,568 |
Source: Public Records
Tax History Compared to Growth
Tax History
| Year | Tax Paid | Tax Assessment Tax Assessment Total Assessment is a certain percentage of the fair market value that is determined by local assessors to be the total taxable value of land and additions on the property. | Land | Improvement |
|---|---|---|---|---|
| 2024 | $2,554 | $22,449 | $3,453 | $18,996 |
| 2023 | $2,554 | $21,795 | $3,491 | $18,304 |
| 2022 | $2,371 | $21,160 | $4,110 | $17,050 |
| 2021 | $2,300 | $20,544 | $4,376 | $16,168 |
| 2020 | $2,256 | $19,946 | $3,250 | $16,696 |
| 2019 | $2,185 | $19,365 | $3,091 | $16,274 |
| 2018 | $2,019 | $18,802 | $0 | $0 |
| 2017 | $1,956 | $18,253 | $3,499 | $14,754 |
| 2016 | $1,897 | $17,722 | $3,052 | $14,670 |
| 2015 | $1,856 | $17,206 | $3,174 | $14,032 |
| 2014 | $1,788 | $16,705 | $3,315 | $13,390 |
Source: Public Records
Map
Nearby Homes
- 2640 NW 27th St
- 2648 NW 27th St
- 2532 NW 26th St
- 2647 NW 24th St
- 2533 NW 25th St
- 2536 NW 25th St
- 2720 NW 26th St
- 2617 NW 23rd St
- 2560 NW 23rd St
- 2749 NW 22nd St
- 2517 NW 22nd St
- 2509 NW 22nd St
- 3004 N Venice Blvd
- 2748 NW 22nd St
- 2508 Cummings Dr
- 2533 NW 21st St
- 2558 NW 21st St
- 2501 NW 21st St
- 2809 NW 21st St
- 2428 NW 22nd St
- 2625 NW 26th St
- 2633 NW 26th St
- 2637 NW 26th St
- 2619 NW 26th St
- 2628 NW 27th St
- 2632 NW 27th St
- 2624 NW 27th St
- 2641 NW 26th St
- 2615 NW 26th St
- 2636 NW 27th St
- 2620 NW 27th St
- 2626 NW 26th St
- 2624 NW 26th St
- 2645 NW 26th St
- 2634 NW 26th St
- 2616 NW 27th St
- 2620 NW 26th St
- 2609 NW 26th St
- 2640 NW 26th St
- 2616 NW 26th St