Estimated Value: $431,000 - $479,000
4
Beds
2
Baths
1,690
Sq Ft
$267/Sq Ft
Est. Value
About This Home
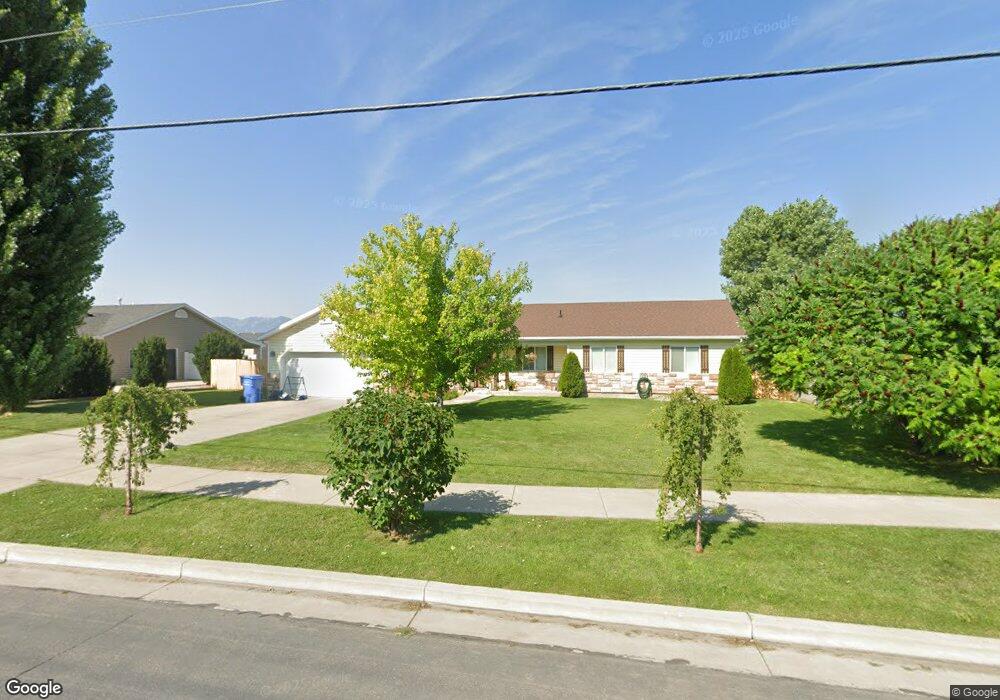
This home is located at 2629 S 800 W, Logan, UT 84321 and is currently estimated at $450,630, approximately $266 per square foot. 2629 S 800 W is a home located in Cache County with nearby schools including Nibley School, Spring Creek Middle School, and South Cache Middle School.
Ownership History
Date
Name
Owned For
Owner Type
Purchase Details
Closed on
Jun 26, 2006
Sold by
Neighborhood Nonprofit Housing Corporati
Bought by
Ream William and Ream Breanne
Current Estimated Value
Home Financials for this Owner
Home Financials are based on the most recent Mortgage that was taken out on this home.
Original Mortgage
$2,000
Outstanding Balance
$1,173
Interest Rate
6.63%
Mortgage Type
Unknown
Estimated Equity
$449,457
Create a Home Valuation Report for This Property
The Home Valuation Report is an in-depth analysis detailing your home's value as well as a comparison with similar homes in the area
Home Values in the Area
Average Home Value in this Area
Purchase History
| Date | Buyer | Sale Price | Title Company |
|---|---|---|---|
| Ream William | -- | Cache Title Company |
Source: Public Records
Mortgage History
| Date | Status | Borrower | Loan Amount |
|---|---|---|---|
| Open | Ream William | $2,000 | |
| Open | Ream William | $151,294 |
Source: Public Records
Tax History
| Year | Tax Paid | Tax Assessment Tax Assessment Total Assessment is a certain percentage of the fair market value that is determined by local assessors to be the total taxable value of land and additions on the property. | Land | Improvement |
|---|---|---|---|---|
| 2025 | $1,684 | $223,265 | $0 | $0 |
| 2024 | $1,786 | $222,220 | $0 | $0 |
| 2023 | $2,187 | $212,175 | $0 | $0 |
| 2022 | $2,276 | $254,815 | $0 | $0 |
| 2021 | $1,642 | $285,482 | $66,800 | $218,682 |
| 2020 | $1,552 | $256,959 | $66,800 | $190,159 |
| 2019 | $1,628 | $256,959 | $66,800 | $190,159 |
| 2018 | $1,382 | $212,785 | $43,000 | $169,785 |
| 2017 | $1,380 | $112,585 | $0 | $0 |
| 2016 | $1,396 | $87,005 | $0 | $0 |
| 2015 | $1,072 | $87,005 | $0 | $0 |
| 2014 | $1,047 | $87,005 | $0 | $0 |
| 2013 | -- | $86,940 | $0 | $0 |
Source: Public Records
Map
Nearby Homes
- 732 W 2840 S Unit 7
- 712 W 2840 S Unit 9
- 702 W 2840 S Unit 10
- 722 W 2840 S Unit 8
- 2463 S 660 W
- 2680 S 600 W
- 939 Nibley Pkwy
- 2770 S 1070 West Sunset Park
- 2814 S 1100 W
- 2882 S 1080 W
- 1045 W 2400 S
- 860 W 2980 S
- 2313 S 1000 W Unit 110
- 2313 S 1000 W
- 2269 Clear Creek Rd
- 2938 S 600 W
- 879 W 2200 S Unit 153
- 879 W 2200 S Unit 155
- 879 W 2200 S Unit 152
- 879 W 2200 S Unit 156
Your Personal Tour Guide
Ask me questions while you tour the home.