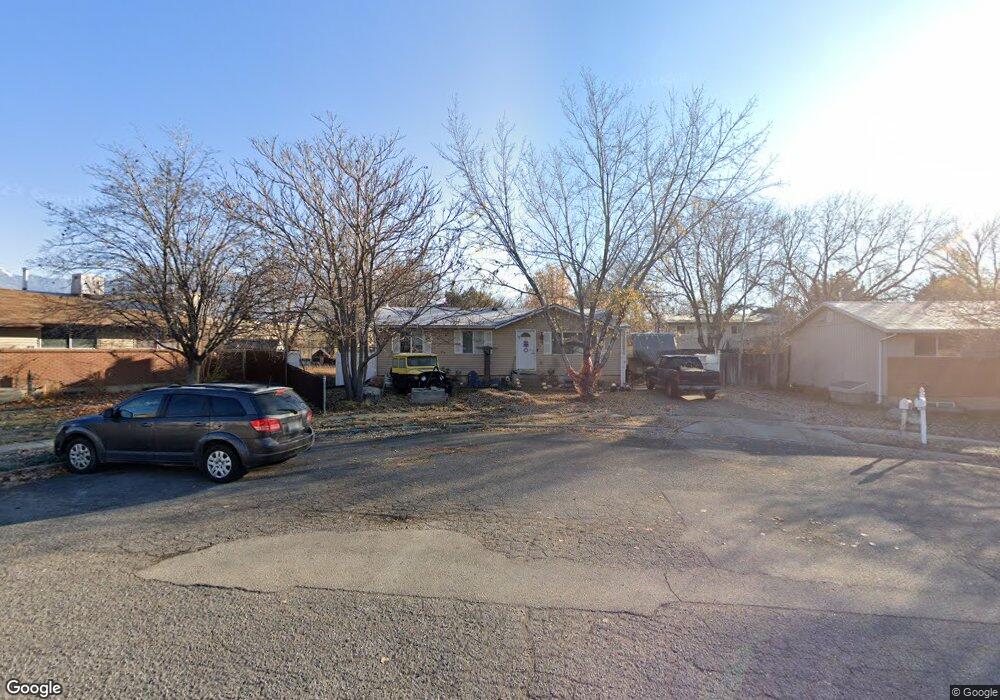
263 Chadwick Cir American Fork, UT 84003
Estimated Value: $471,000 - $517,000
5
Beds
2
Baths
2,100
Sq Ft
$238/Sq Ft
Est. Value
About This Home
This home is located at 263 Chadwick Cir, American Fork, UT 84003 and is currently estimated at $499,408, approximately $237 per square foot. 263 Chadwick Cir is a home located in Utah County with nearby schools including Greenwood Elementary School, American Fork Junior High School, and American Fork High School.
Ownership History
Date
Name
Owned For
Owner Type
Purchase Details
Closed on
Feb 25, 2015
Sold by
Clark Richard
Bought by
Clark Richard and Clark Emily
Current Estimated Value
Home Financials for this Owner
Home Financials are based on the most recent Mortgage that was taken out on this home.
Original Mortgage
$174,800
Outstanding Balance
$133,532
Interest Rate
3.61%
Mortgage Type
New Conventional
Estimated Equity
$365,876
Purchase Details
Closed on
Dec 20, 2012
Sold by
Barnett Josh
Bought by
Barnett Josh and Barnett Carrie
Home Financials for this Owner
Home Financials are based on the most recent Mortgage that was taken out on this home.
Original Mortgage
$111,410
Interest Rate
3.25%
Mortgage Type
FHA
Purchase Details
Closed on
Oct 28, 2002
Sold by
Howes Benjamin F and Howes Lurae M
Bought by
Barnett Josh
Home Financials for this Owner
Home Financials are based on the most recent Mortgage that was taken out on this home.
Original Mortgage
$132,815
Interest Rate
6.09%
Mortgage Type
FHA
Create a Home Valuation Report for This Property
The Home Valuation Report is an in-depth analysis detailing your home's value as well as a comparison with similar homes in the area
Home Values in the Area
Average Home Value in this Area
Purchase History
| Date | Buyer | Sale Price | Title Company |
|---|---|---|---|
| Clark Richard | -- | Bartlett Title Ins Agen | |
| Clark Richard | -- | Affiliated First Title Co | |
| Barnett Josh | -- | Absolute Title Agency | |
| Barnett Josh | -- | Equity Title Agency Inc |
Source: Public Records
Mortgage History
| Date | Status | Borrower | Loan Amount |
|---|---|---|---|
| Open | Clark Richard | $174,800 | |
| Previous Owner | Barnett Josh | $111,410 | |
| Previous Owner | Barnett Josh | $132,815 |
Source: Public Records
Tax History Compared to Growth
Tax History
| Year | Tax Paid | Tax Assessment Tax Assessment Total Assessment is a certain percentage of the fair market value that is determined by local assessors to be the total taxable value of land and additions on the property. | Land | Improvement |
|---|---|---|---|---|
| 2025 | $1,947 | $245,850 | $198,000 | $249,000 |
| 2024 | $1,947 | $216,370 | $0 | $0 |
| 2023 | $1,806 | $212,795 | $0 | $0 |
| 2022 | $1,912 | $222,310 | $0 | $0 |
| 2021 | $1,582 | $287,200 | $124,300 | $162,900 |
| 2020 | $1,487 | $261,800 | $111,000 | $150,800 |
| 2019 | $1,380 | $251,400 | $100,600 | $150,800 |
| 2018 | $1,291 | $224,800 | $93,700 | $131,100 |
| 2017 | $1,228 | $115,390 | $0 | $0 |
| 2016 | $1,171 | $102,245 | $0 | $0 |
| 2015 | $1,122 | $93,005 | $0 | $0 |
| 2014 | $1,039 | $84,975 | $0 | $0 |
Source: Public Records
Map
Nearby Homes
- 271 S Barratt Cir
- 382 W 330 S
- 365 W 370 S
- 391 W 370 S
- 316 W 390 S
- 82 S Lincoln Ave
- 351 Washington Ave
- 412 S 390 W
- 424 S 340 W
- 55 Roosevelt Ave
- 429 S Storrs Ave
- 368 S Storrs Ct Unit 107
- 55 S 200 W
- 217 W Main St
- 326 S 650 W
- 120 N 350 W Unit 127
- 120 N 350 W Unit 133
- 120 N 350 W Unit 130
- 304 S 680 W
- 334 S 680 W