Estimated Value: $347,000 - $368,000
5
Beds
2
Baths
958
Sq Ft
$373/Sq Ft
Est. Value
About This Home
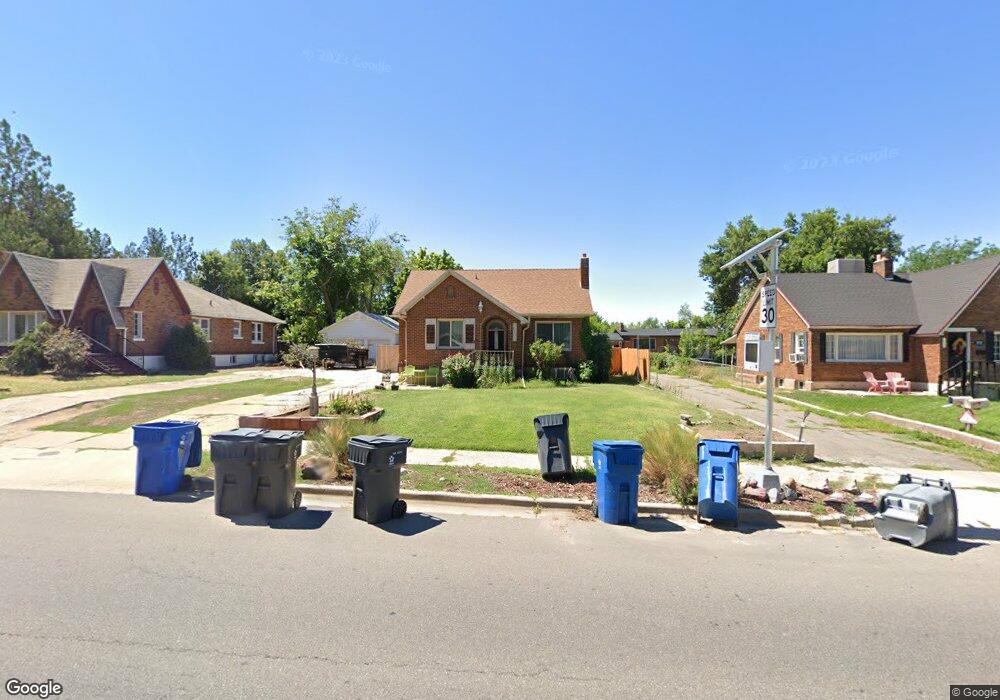
This home is located at 263 Chimes View Dr, Ogden, UT 84405 and is currently estimated at $356,883, approximately $372 per square foot. 263 Chimes View Dr is a home located in Weber County with nearby schools including Burch Creek School, South Ogden Junior High School, and Bonneville High School.
Ownership History
Date
Name
Owned For
Owner Type
Purchase Details
Closed on
Dec 23, 2004
Sold by
Darling Michael Joseph and Peterson Marilyn
Bought by
Darling Michael J and Darling Marilyn P
Current Estimated Value
Home Financials for this Owner
Home Financials are based on the most recent Mortgage that was taken out on this home.
Original Mortgage
$105,300
Outstanding Balance
$58,810
Interest Rate
7.5%
Mortgage Type
New Conventional
Estimated Equity
$298,073
Purchase Details
Closed on
May 13, 2002
Sold by
Jensen Wallace L and Jensen Maxine R
Bought by
Darling Michael Joseph and Peterson Marilyn
Home Financials for this Owner
Home Financials are based on the most recent Mortgage that was taken out on this home.
Original Mortgage
$95,000
Interest Rate
7.18%
Mortgage Type
Seller Take Back
Create a Home Valuation Report for This Property
The Home Valuation Report is an in-depth analysis detailing your home's value as well as a comparison with similar homes in the area
Home Values in the Area
Average Home Value in this Area
Purchase History
| Date | Buyer | Sale Price | Title Company |
|---|---|---|---|
| Darling Michael J | -- | Guardian Title Company Of Ut | |
| Darling Michael Joseph | -- | -- |
Source: Public Records
Mortgage History
| Date | Status | Borrower | Loan Amount |
|---|---|---|---|
| Open | Darling Michael J | $105,300 | |
| Closed | Darling Michael Joseph | $95,000 |
Source: Public Records
Tax History
| Year | Tax Paid | Tax Assessment Tax Assessment Total Assessment is a certain percentage of the fair market value that is determined by local assessors to be the total taxable value of land and additions on the property. | Land | Improvement |
|---|---|---|---|---|
| 2025 | $2,370 | $177,078 | $47,616 | $129,462 |
| 2024 | $2,259 | $172,697 | $47,615 | $125,082 |
| 2023 | $2,151 | $165,000 | $48,162 | $116,838 |
| 2022 | $2,293 | $184,250 | $43,644 | $140,606 |
| 2021 | $1,682 | $218,999 | $45,452 | $173,547 |
| 2020 | $1,587 | $191,999 | $32,888 | $159,111 |
| 2019 | $1,473 | $168,000 | $24,484 | $143,516 |
| 2018 | $1,415 | $153,000 | $24,484 | $128,516 |
| 2017 | $1,276 | $130,000 | $22,013 | $107,987 |
| 2016 | $1,231 | $70,022 | $10,828 | $59,194 |
| 2015 | $1,103 | $59,757 | $10,828 | $48,929 |
| 2014 | $1,082 | $58,200 | $10,828 | $47,372 |
Source: Public Records
Map
Nearby Homes
- 3874 Childs Ave
- 26 Sylvia Dr
- 325 E Chimes View Cir
- 302 40th St
- 239 E Burch Creek Place
- 215 40th St
- 241 E Burch Creek Place
- 225 Chimes View Cir
- 4006 S Burch Creek Way
- 4010 S Burch Creek Way
- 4024 S Burch Creek Way
- 4055 Hillcrest Cir
- 4067 Hillcrest Cir
- 428 37th St
- 137 Country Club Dr
- 149 Country Club Dr
- 260 36th St
- 254 36th St
- 3683 Adams Ave
- 4014 Porter Ave
- 253 Chimes View Dr
- 267 Chimes View Dr
- 257 Chimes View Dr
- 251 Chimes View Dr
- 273 Chimes View Dr
- 273 Chimes View Dr
- 255 Chimes View Dr
- 271 Chimes View Dr
- 266 Chimes View Dr
- 3890 Childs Ave
- 277 Chimes View Dr
- 241 Chimes View Dr
- 3880 Childs Ave
- 286 39th St
- 291 Chimes View Dr
- 232 E 40 St S
- 236 Chimes View Dr
- 231 Chimes View Dr
- 3889 Grant Ave
- 299 Chimes View Dr
Your Personal Tour Guide
Ask me questions while you tour the home.