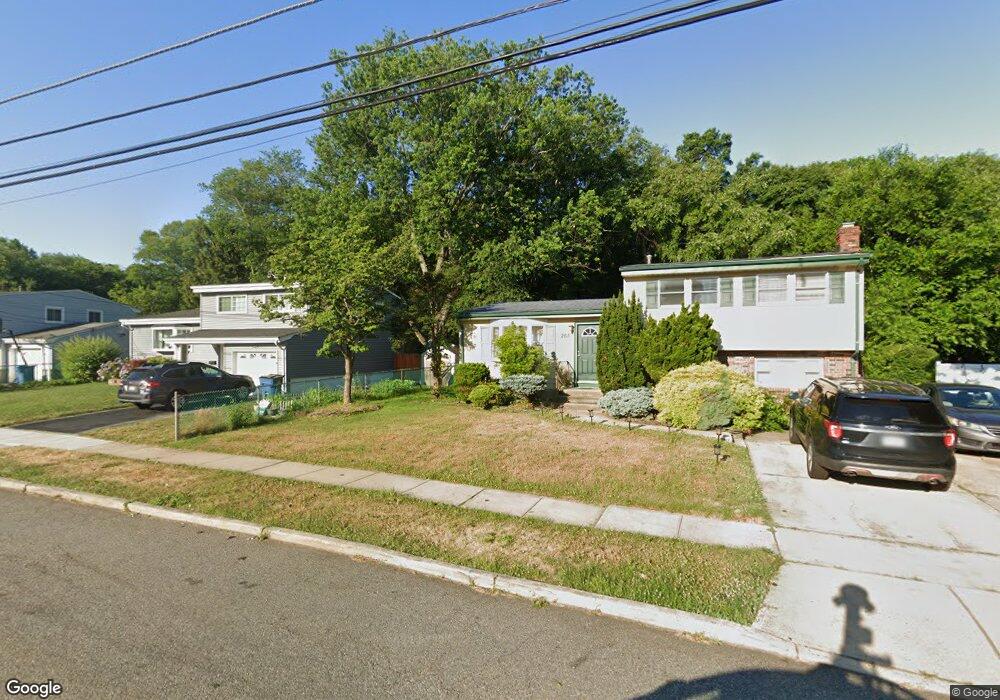
263 Cindy St Old Bridge, NJ 08857
Estimated Value: $516,410 - $643,000
Studio
--
Bath
1,659
Sq Ft
$363/Sq Ft
Est. Value
About This Home
This home is located at 263 Cindy St, Old Bridge, NJ 08857 and is currently estimated at $602,353, approximately $363 per square foot. 263 Cindy St is a home located in Middlesex County with nearby schools including Old Bridge High School, St. Ambrose School, and Calvary Christian School.
Ownership History
Date
Name
Owned For
Owner Type
Purchase Details
Closed on
May 13, 2005
Sold by
Maldonado Christine
Bought by
Haney Arthur and Haney Carol
Current Estimated Value
Home Financials for this Owner
Home Financials are based on the most recent Mortgage that was taken out on this home.
Original Mortgage
$317,588
Outstanding Balance
$166,655
Interest Rate
5.94%
Mortgage Type
FHA
Estimated Equity
$435,698
Purchase Details
Closed on
Sep 15, 2000
Sold by
Hanley Martin
Bought by
Maldonado John and Maldonado Christine
Home Financials for this Owner
Home Financials are based on the most recent Mortgage that was taken out on this home.
Original Mortgage
$178,000
Interest Rate
8%
Create a Home Valuation Report for This Property
The Home Valuation Report is an in-depth analysis detailing your home's value as well as a comparison with similar homes in the area
Home Values in the Area
Average Home Value in this Area
Purchase History
| Date | Buyer | Sale Price | Title Company |
|---|---|---|---|
| Haney Arthur | $330,000 | -- | |
| Maldonado John | $198,000 | -- |
Source: Public Records
Mortgage History
| Date | Status | Borrower | Loan Amount |
|---|---|---|---|
| Open | Haney Arthur | $317,588 | |
| Previous Owner | Maldonado John | $178,000 |
Source: Public Records
Tax History
| Year | Tax Paid | Tax Assessment Tax Assessment Total Assessment is a certain percentage of the fair market value that is determined by local assessors to be the total taxable value of land and additions on the property. | Land | Improvement |
|---|---|---|---|---|
| 2025 | $8,533 | $151,100 | $70,400 | $80,700 |
| 2024 | $8,185 | $151,100 | $70,400 | $80,700 |
Source: Public Records
Map
Nearby Homes
Your Personal Tour Guide
Ask me questions while you tour the home.