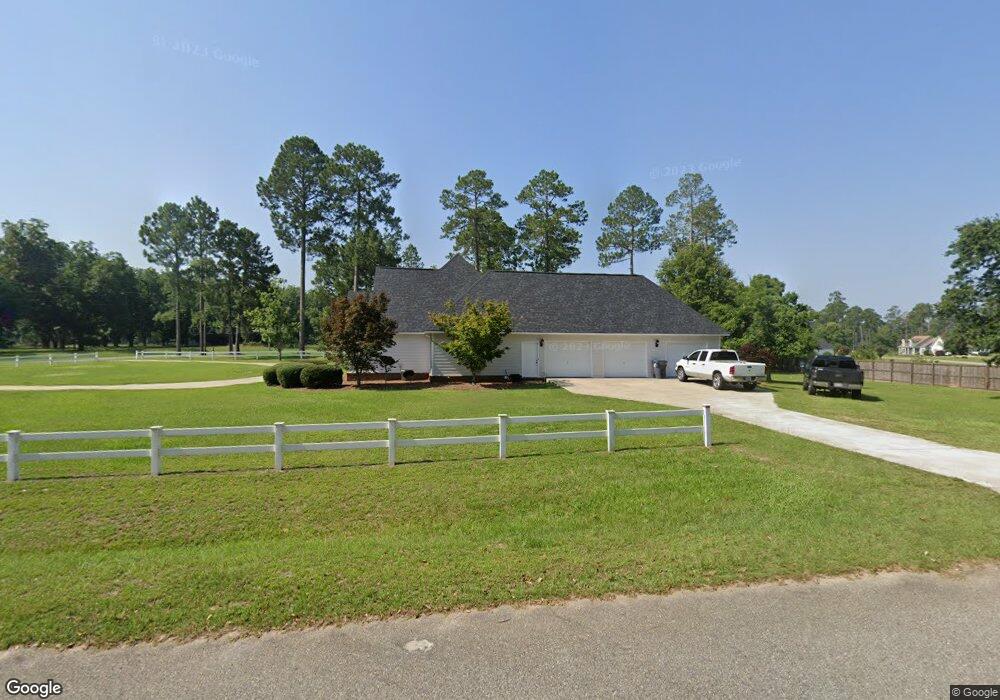
263 Coney Rd N Cordele, GA 31015
Estimated Value: $333,000 - $454,000
4
Beds
3
Baths
2,661
Sq Ft
$140/Sq Ft
Est. Value
About This Home
This home is located at 263 Coney Rd N, Cordele, GA 31015 and is currently estimated at $373,516, approximately $140 per square foot. 263 Coney Rd N is a home located in Crisp County with nearby schools including Crisp County Elementary School, Crisp County Primary School, and Crisp County Middle School.
Ownership History
Date
Name
Owned For
Owner Type
Purchase Details
Closed on
Sep 25, 2015
Sold by
Federal National Mortgage Association
Bought by
Smith John Lee and Smith Lachantay
Current Estimated Value
Home Financials for this Owner
Home Financials are based on the most recent Mortgage that was taken out on this home.
Original Mortgage
$176,641
Outstanding Balance
$137,202
Interest Rate
3.75%
Mortgage Type
FHA
Estimated Equity
$236,314
Purchase Details
Closed on
Jun 2, 2015
Sold by
Federal National Mortgage Association
Bought by
Federal National Mtg Associati
Purchase Details
Closed on
Aug 18, 2004
Sold by
Hampton Derrell
Bought by
Walker Van Essie
Purchase Details
Closed on
Mar 21, 2000
Bought by
Hampton Derrell
Create a Home Valuation Report for This Property
The Home Valuation Report is an in-depth analysis detailing your home's value as well as a comparison with similar homes in the area
Home Values in the Area
Average Home Value in this Area
Purchase History
| Date | Buyer | Sale Price | Title Company |
|---|---|---|---|
| Smith John Lee | $179,900 | -- | |
| Federal National Mtg Associati | -- | -- | |
| Walker Van Essie | $24,900 | -- | |
| Hampton Derrell | -- | -- |
Source: Public Records
Mortgage History
| Date | Status | Borrower | Loan Amount |
|---|---|---|---|
| Open | Smith John Lee | $176,641 |
Source: Public Records
Tax History Compared to Growth
Tax History
| Year | Tax Paid | Tax Assessment Tax Assessment Total Assessment is a certain percentage of the fair market value that is determined by local assessors to be the total taxable value of land and additions on the property. | Land | Improvement |
|---|---|---|---|---|
| 2025 | $2,796 | $115,835 | $4,800 | $111,035 |
| 2024 | $2,796 | $105,249 | $4,000 | $101,249 |
| 2023 | $2,762 | $100,356 | $4,000 | $96,356 |
| 2022 | $2,625 | $95,462 | $4,000 | $91,462 |
| 2021 | $2,686 | $90,570 | $4,000 | $86,570 |
| 2020 | $2,630 | $90,570 | $4,000 | $86,570 |
| 2019 | $2,614 | $90,570 | $4,000 | $86,570 |
| 2018 | $2,781 | $92,813 | $4,000 | $88,813 |
| 2017 | $2,854 | $92,813 | $4,000 | $88,813 |
| 2016 | $2,149 | $94,813 | $6,000 | $88,813 |
| 2015 | -- | $94,813 | $6,000 | $88,813 |
| 2014 | -- | $94,813 | $6,000 | $88,813 |
| 2013 | -- | $94,812 | $6,000 | $88,812 |
Source: Public Records
Map
Nearby Homes
- lot 23 Blk A - N Coney Rd
- lot 13 Blk A - N Coney Rd
- lot 12 Blk A - N Coney Rd
- lot 12 Blk B - Swann Dr
- lot 10 Blk B - Swann Dr
- lot 9 Blk B Swann Dr
- lot 45 Blk A - Swann Dr
- lot 48 Blk A - Swann Dr
- lot 47 Blk A - Swann Dr
- lot 46 Blk A - Swann Dr
- lot 11 Blk B - Swann Dr
- lot 22 Blk A - N Coney Rd
- 2 Valhalla Rd S
- 4 Valhalla Rd S
- 3 Valhalla Rd S
- 118 Valhalla Rd S
- 120 Valhalla Rd
- 132 Valhalla Rd S
- 241 Valhalla Rd Lot 1
- 114 N Valhalla Dr