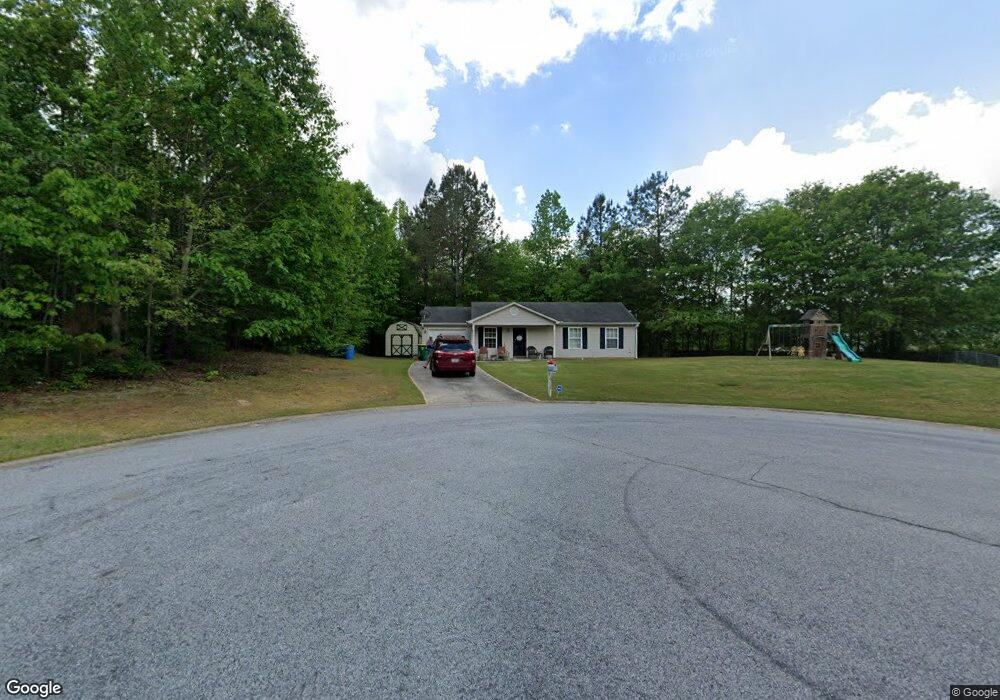
263 Dreamland Cir Winder, GA 30680
Estimated Value: $257,000 - $269,000
3
Beds
2
Baths
1,020
Sq Ft
$257/Sq Ft
Est. Value
About This Home
This home is located at 263 Dreamland Cir, Winder, GA 30680 and is currently estimated at $261,752, approximately $256 per square foot. 263 Dreamland Cir is a home located in Barrow County with nearby schools including Holsenbeck Elementary School, Bear Creek Middle School, and Winder-Barrow High School.
Ownership History
Date
Name
Owned For
Owner Type
Purchase Details
Closed on
Mar 25, 2011
Sold by
Hud-Housing Of Urban Dev
Bought by
Hutton Roger and Hutton Daphne
Current Estimated Value
Purchase Details
Closed on
Nov 2, 2010
Sold by
Wells Fargo Bk Na
Bought by
Hud-Housing Of Urban Dev
Purchase Details
Closed on
Oct 25, 2002
Sold by
Starcraft Properties
Bought by
Donner Mark and Donner Jenny
Home Financials for this Owner
Home Financials are based on the most recent Mortgage that was taken out on this home.
Original Mortgage
$98,455
Interest Rate
6.21%
Mortgage Type
New Conventional
Purchase Details
Closed on
Oct 11, 2002
Sold by
Hoover James
Bought by
Starcraft Properties
Home Financials for this Owner
Home Financials are based on the most recent Mortgage that was taken out on this home.
Original Mortgage
$98,455
Interest Rate
6.21%
Mortgage Type
New Conventional
Purchase Details
Closed on
Nov 12, 2001
Bought by
Hoover James
Create a Home Valuation Report for This Property
The Home Valuation Report is an in-depth analysis detailing your home's value as well as a comparison with similar homes in the area
Home Values in the Area
Average Home Value in this Area
Purchase History
| Date | Buyer | Sale Price | Title Company |
|---|---|---|---|
| Hutton Roger | -- | -- | |
| Hud-Housing Of Urban Dev | -- | -- | |
| Wells Fargo Bk Na | $93,899 | -- | |
| Secretary Of Housing & Urban Dev | $93,900 | -- | |
| Donner Mark | $100,000 | -- | |
| Starcraft Properties | $22,800 | -- | |
| Hoover James | -- | -- |
Source: Public Records
Mortgage History
| Date | Status | Borrower | Loan Amount |
|---|---|---|---|
| Previous Owner | Donner Mark | $98,455 |
Source: Public Records
Tax History Compared to Growth
Tax History
| Year | Tax Paid | Tax Assessment Tax Assessment Total Assessment is a certain percentage of the fair market value that is determined by local assessors to be the total taxable value of land and additions on the property. | Land | Improvement |
|---|---|---|---|---|
| 2024 | $2,311 | $84,830 | $21,600 | $63,230 |
| 2023 | $1,837 | $84,830 | $21,600 | $63,230 |
| 2022 | $1,818 | $56,398 | $12,000 | $44,398 |
| 2021 | $1,863 | $56,398 | $12,000 | $44,398 |
| 2020 | $1,436 | $44,245 | $10,000 | $34,245 |
| 2019 | $1,389 | $42,245 | $8,000 | $34,245 |
| 2018 | $1,233 | $37,732 | $8,000 | $29,732 |
| 2017 | $868 | $29,076 | $8,000 | $21,076 |
| 2016 | $690 | $23,997 | $4,800 | $19,197 |
| 2015 | $698 | $24,210 | $4,800 | $19,410 |
| 2014 | $631 | $22,994 | $5,292 | $17,702 |
| 2013 | -- | $23,967 | $5,292 | $18,675 |
Source: Public Records
Map
Nearby Homes
- 337 Dreamland Ct
- 337 Dreamland Ct
- 335 Dreamland Ct
- 264 Dreamland Cir Unit 2
- 333 Dreamland Ct
- 260 Dreamland Cir
- 262 Dreamland Cir Unit 2
- 258 Dreamland Cir Unit 1
- 331 Dreamland Ct
- 257 Dreamland Cir
- 329 Dreamland Ct
- 329 Dreamland Ct
- 332 Dreamland Ct
- 256 Dreamland Cir
- 327 Dreamland Ct Unit 2
- 251 Dreamland Cir
- 330 Dreamland Ct
- 0 Dreamland Cir Unit 7257145
- 0 Dreamland Cir
- 252 Dreamland Cir