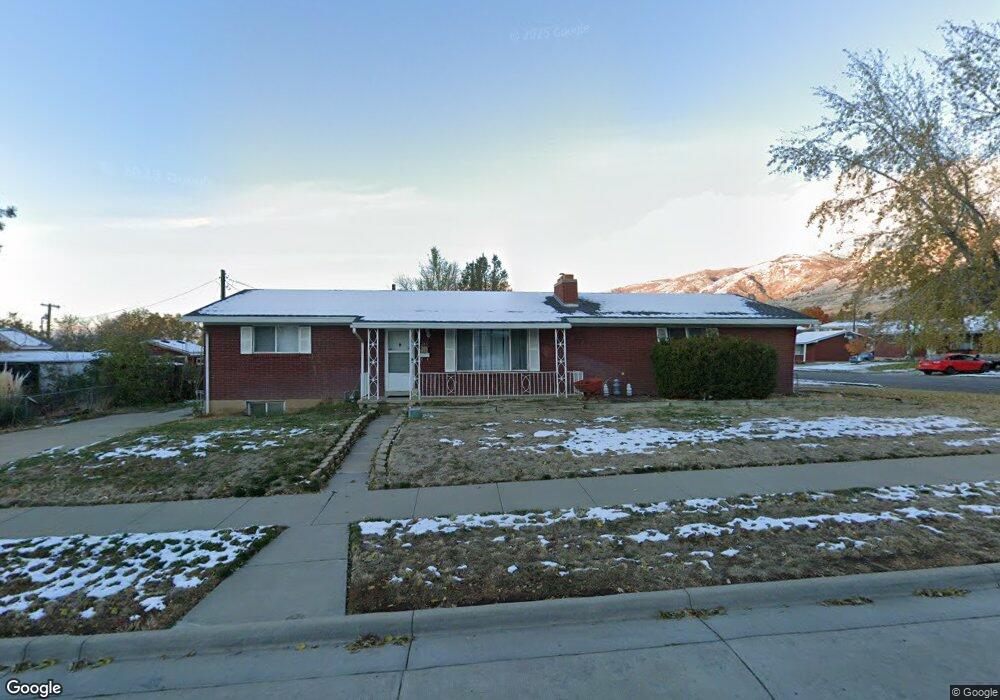
263 E 400 N Bountiful, UT 84010
Estimated Value: $440,000 - $472,580
2
Beds
1
Bath
1,066
Sq Ft
$432/Sq Ft
Est. Value
About This Home
This home is located at 263 E 400 N, Bountiful, UT 84010 and is currently estimated at $460,645, approximately $432 per square foot. 263 E 400 N is a home located in Davis County with nearby schools including Tolman School, Bountiful Junior High School, and Viewmont High School.
Ownership History
Date
Name
Owned For
Owner Type
Purchase Details
Closed on
Aug 5, 2005
Sold by
Crist Bradley D and Sherman J Sherman J
Bought by
Montoya Michelle L
Current Estimated Value
Home Financials for this Owner
Home Financials are based on the most recent Mortgage that was taken out on this home.
Original Mortgage
$171,311
Outstanding Balance
$88,384
Interest Rate
5.48%
Mortgage Type
FHA
Estimated Equity
$372,261
Purchase Details
Closed on
Aug 8, 2001
Sold by
Crist Neil B
Bought by
Crist Bradley D and Sherman Peterson J
Purchase Details
Closed on
Apr 13, 2001
Sold by
Crist Bradley D and Sherman Peterson J
Bought by
Crist Neil B
Purchase Details
Closed on
Jul 14, 2000
Sold by
Crist Neil B
Bought by
Crist Bradley D and Sherman Peterson J
Purchase Details
Closed on
Jan 20, 1998
Sold by
Shirley Paul L and Shirley Brooke E
Bought by
Crist Neil B
Home Financials for this Owner
Home Financials are based on the most recent Mortgage that was taken out on this home.
Original Mortgage
$101,850
Interest Rate
7.13%
Create a Home Valuation Report for This Property
The Home Valuation Report is an in-depth analysis detailing your home's value as well as a comparison with similar homes in the area
Purchase History
| Date | Buyer | Sale Price | Title Company |
|---|---|---|---|
| Montoya Michelle L | -- | First American Title | |
| Crist Bradley D | -- | -- | |
| Crist Neil B | -- | Inwest Title Services Inc | |
| Crist Bradley D | -- | -- | |
| Crist Neil B | -- | Security Title Company |
Source: Public Records
Mortgage History
| Date | Status | Borrower | Loan Amount |
|---|---|---|---|
| Open | Montoya Michelle L | $171,311 | |
| Previous Owner | Crist Neil B | $101,850 |
Source: Public Records
Tax History
| Year | Tax Paid | Tax Assessment Tax Assessment Total Assessment is a certain percentage of the fair market value that is determined by local assessors to be the total taxable value of land and additions on the property. | Land | Improvement |
|---|---|---|---|---|
| 2025 | $2,638 | $238,700 | $94,931 | $143,769 |
| 2024 | $2,460 | $231,550 | $83,216 | $148,334 |
| 2023 | $2,438 | $417,000 | $193,274 | $223,726 |
| 2022 | $2,446 | $229,350 | $90,145 | $139,205 |
| 2021 | $2,259 | $324,000 | $117,906 | $206,094 |
| 2020 | $1,887 | $270,000 | $102,293 | $167,707 |
| 2019 | $2,027 | $272,000 | $110,826 | $161,174 |
| 2018 | $1,788 | $246,000 | $108,701 | $137,299 |
| 2016 | $1,551 | $111,100 | $44,265 | $66,835 |
| 2015 | $1,436 | $100,485 | $44,265 | $56,220 |
| 2014 | $1,483 | $107,309 | $44,265 | $63,044 |
| 2013 | -- | $91,721 | $40,746 | $50,975 |
Source: Public Records
Map
Nearby Homes
- 453 N 400 E Unit 7-D
- 513 N 400 E Unit 14B
- 17 E 400 N Unit 19B
- 49 E 200 N Unit 4
- 41 E 200 N Unit 6
- 55 E 200 N Unit 2
- 51 E 200 N Unit 3
- 256 N Main St
- 254 N Main St
- 252 N Main St
- 978 N 170 E
- 683 E 100 N
- 106 W 700 N
- 214 E 1250 N
- 320 N 200 W Unit 4
- 129 N 800 E
- 255 E 400 S
- 357 S 100 E
- 332 N 300 W
- 499 N 200 W Unit 30
Your Personal Tour Guide
Ask me questions while you tour the home.