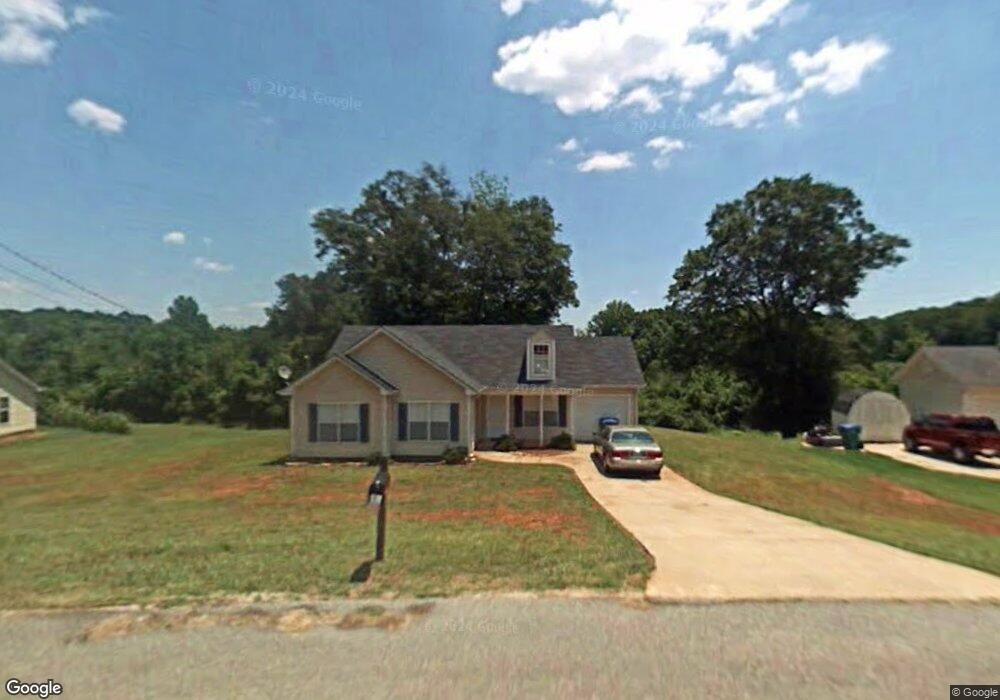
263 Elrod Ave Unit 13 Jefferson, GA 30549
Estimated Value: $254,000 - $261,000
3
Beds
2
Baths
1,008
Sq Ft
$257/Sq Ft
Est. Value
About This Home
This home is located at 263 Elrod Ave Unit 13, Jefferson, GA 30549 and is currently estimated at $258,797, approximately $256 per square foot. 263 Elrod Ave Unit 13 is a home located in Jackson County with nearby schools including Jefferson Elementary School, Jefferson Academy, and Jefferson Middle School.
Ownership History
Date
Name
Owned For
Owner Type
Purchase Details
Closed on
Jun 10, 2024
Sold by
Crocker Dylan Reid
Bought by
Ledford Merilee and Ledford Roger L
Current Estimated Value
Purchase Details
Closed on
Oct 26, 2023
Sold by
Ledford Roger Lamar
Bought by
Crocker Dylan Reid and Crocker Kelli Ledford
Purchase Details
Closed on
Mar 8, 2017
Sold by
Trunk Frederick A
Bought by
Ledford Merilee and Ledford Roger
Purchase Details
Closed on
Jan 12, 2007
Sold by
Not Provided
Bought by
Trunk Frederick A and Trunk Marjorie
Home Financials for this Owner
Home Financials are based on the most recent Mortgage that was taken out on this home.
Original Mortgage
$102,650
Interest Rate
6.08%
Mortgage Type
New Conventional
Purchase Details
Closed on
Feb 18, 2004
Sold by
Jakway David E
Bought by
Jakway David E
Purchase Details
Closed on
Aug 8, 2000
Sold by
Bji Inc
Bought by
Jakway David E
Purchase Details
Closed on
Oct 20, 1999
Sold by
Huroja Llp
Bought by
Bji Inc
Purchase Details
Closed on
Sep 24, 1999
Bought by
Huroja Llp
Create a Home Valuation Report for This Property
The Home Valuation Report is an in-depth analysis detailing your home's value as well as a comparison with similar homes in the area
Home Values in the Area
Average Home Value in this Area
Purchase History
| Date | Buyer | Sale Price | Title Company |
|---|---|---|---|
| Ledford Merilee | -- | -- | |
| Crocker Dylan Reid | -- | -- | |
| Ledford Merilee | $107,000 | -- | |
| Trunk Frederick A | $102,700 | -- | |
| Jakway David E | -- | -- | |
| Jakway David E | $76,900 | -- | |
| Bji Inc | $13,900 | -- | |
| Huroja Llp | -- | -- |
Source: Public Records
Mortgage History
| Date | Status | Borrower | Loan Amount |
|---|---|---|---|
| Previous Owner | Trunk Frederick A | $102,650 |
Source: Public Records
Tax History Compared to Growth
Tax History
| Year | Tax Paid | Tax Assessment Tax Assessment Total Assessment is a certain percentage of the fair market value that is determined by local assessors to be the total taxable value of land and additions on the property. | Land | Improvement |
|---|---|---|---|---|
| 2024 | $1,794 | $65,080 | $22,000 | $43,080 |
| 2023 | $1,794 | $50,120 | $12,800 | $37,320 |
| 2022 | $1,394 | $43,360 | $12,800 | $30,560 |
| 2021 | $1,419 | $43,360 | $12,800 | $30,560 |
| 2020 | $1,130 | $32,240 | $8,000 | $24,240 |
| 2019 | $1,147 | $32,240 | $8,000 | $24,240 |
| 2018 | $1,114 | $31,080 | $8,000 | $23,080 |
| 2017 | $495 | $30,665 | $8,000 | $22,665 |
| 2016 | $482 | $29,865 | $7,200 | $22,665 |
| 2015 | $416 | $26,665 | $4,000 | $22,665 |
| 2014 | $332 | $22,512 | $4,000 | $18,512 |
| 2013 | -- | $16,267 | $3,200 | $13,067 |
Source: Public Records
Map
Nearby Homes
- 143 Elrod Ave
- 191 Georgia Belle Dr
- 176 Crimson Feather Dr
- 242 Carriage Ave
- 131 Martin Luther King jr Dr
- 86 Martin Luther King jr Dr
- 860 Canter Way
- 726 Peachtree Rd
- 642 Canter Way
- 0 Georgia 82 N
- Atlanta Plan at Jefferson Hills
- Roswell Plan at Jefferson Hills
- Portland w/ Basement Plan at Jefferson Hills
- Boston Plan at Jefferson Hills
- Portland Plan at Jefferson Hills
- Boston w/ Basement Plan at Jefferson Hills
- Roswell w/ Basement Plan at Jefferson Hills
- 105 Elijah St
- 129 Elijah St
- 508 Red Dragon Dr
- 263 Elrod Ave
- 277 Elrod Ave
- 249 Elrod Ave
- 268 Elrod Ave
- 295 Elrod Ave
- 223 Elrod Ave
- 120 Hampton Dr
- 284 Elrod Ave
- 311 Elrod Ave
- 172 Fairfield Dr
- 25 Elberta Dr
- 51 Elberta Dr
- 205 Elrod Ave
- 88 Hampton Dr
- 302 Elrod Ave
- 126 Hampton Dr
- 0 Hampton Dr Unit 7222820
- 0 Hampton Dr Unit 8709284
- 0 Hampton Dr Unit 8375151
- 0 Hampton Dr Unit 8178782