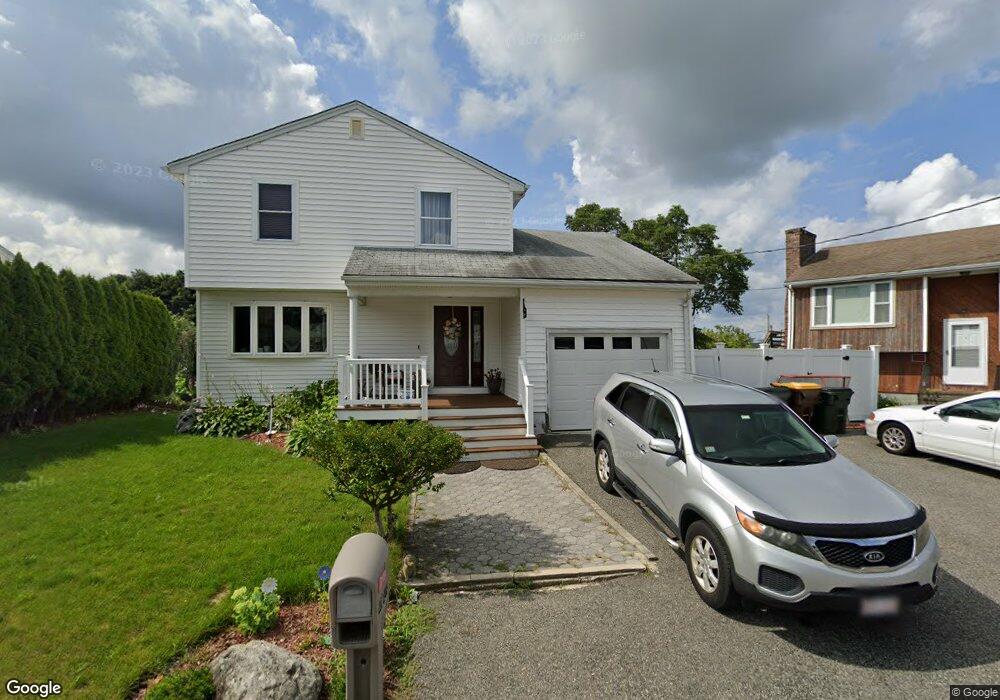
263 Embert St Fall River, MA 02721
Maplewood NeighborhoodEstimated Value: $373,000 - $433,000
3
Beds
2
Baths
1,661
Sq Ft
$245/Sq Ft
Est. Value
About This Home
This home is located at 263 Embert St, Fall River, MA 02721 and is currently estimated at $407,458, approximately $245 per square foot. 263 Embert St is a home located in Bristol County with nearby schools including Letourneau Elementary School, Matthew J. Kuss Middle School, and B M C Durfee High School.
Ownership History
Date
Name
Owned For
Owner Type
Purchase Details
Closed on
Oct 23, 1987
Sold by
Rezendes Kenneth J
Bought by
Silva Francisco J
Current Estimated Value
Create a Home Valuation Report for This Property
The Home Valuation Report is an in-depth analysis detailing your home's value as well as a comparison with similar homes in the area
Home Values in the Area
Average Home Value in this Area
Purchase History
| Date | Buyer | Sale Price | Title Company |
|---|---|---|---|
| Silva Francisco J | $127,000 | -- |
Source: Public Records
Mortgage History
| Date | Status | Borrower | Loan Amount |
|---|---|---|---|
| Open | Silva Francisco J | $188,000 | |
| Closed | Silva Francisco J | $45,000 | |
| Closed | Silva Francisco J | $30,000 |
Source: Public Records
Tax History
| Year | Tax Paid | Tax Assessment Tax Assessment Total Assessment is a certain percentage of the fair market value that is determined by local assessors to be the total taxable value of land and additions on the property. | Land | Improvement |
|---|---|---|---|---|
| 2025 | $3,319 | $289,900 | $116,400 | $173,500 |
| 2024 | $3,154 | $274,500 | $114,200 | $160,300 |
| 2023 | $3,245 | $264,500 | $102,900 | $161,600 |
| 2022 | $2,943 | $233,200 | $97,000 | $136,200 |
| 2021 | $2,845 | $205,700 | $92,700 | $113,000 |
| 2020 | $2,806 | $194,200 | $88,500 | $105,700 |
| 2019 | $2,834 | $194,400 | $92,500 | $101,900 |
| 2018 | $2,785 | $190,500 | $93,200 | $97,300 |
| 2017 | $2,646 | $189,000 | $93,200 | $95,800 |
| 2016 | $2,545 | $186,700 | $96,000 | $90,700 |
| 2015 | $2,477 | $189,400 | $96,000 | $93,400 |
| 2014 | $2,383 | $189,400 | $96,000 | $93,400 |
Source: Public Records
Map
Nearby Homes
Your Personal Tour Guide
Ask me questions while you tour the home.