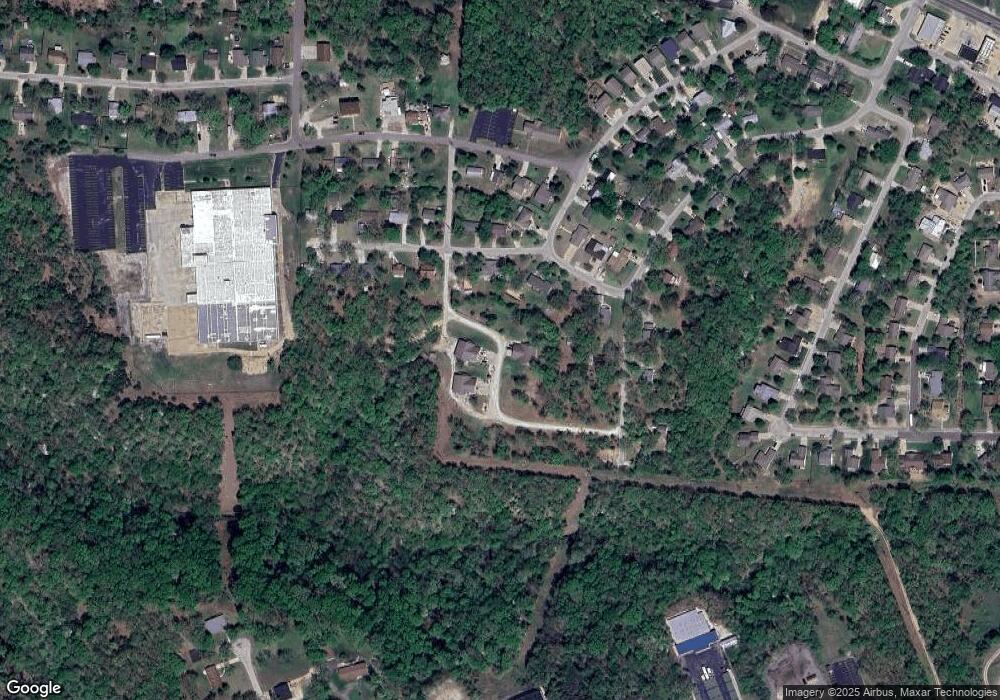
263 Hidden Oaks Camdenton, MO 65020
Estimated Value: $967,000 - $1,136,372
5
Beds
7
Baths
4,100
Sq Ft
$257/Sq Ft
Est. Value
About This Home
This home is located at 263 Hidden Oaks, Camdenton, MO 65020 and is currently estimated at $1,052,343, approximately $256 per square foot. 263 Hidden Oaks is a home located in Camden County with nearby schools including Camdenton High School.
Ownership History
Date
Name
Owned For
Owner Type
Purchase Details
Closed on
Oct 3, 2024
Sold by
Leger Family Revocable Living Trust and Leger Timothy Scott
Bought by
Ttl Properties Llc
Current Estimated Value
Purchase Details
Closed on
Mar 2, 2022
Sold by
Coe Kevin R and Coe Christine M
Bought by
Leger Timothy Scott Te and Leger Teresa Sue
Home Financials for this Owner
Home Financials are based on the most recent Mortgage that was taken out on this home.
Original Mortgage
$511,494
Interest Rate
4.17%
Mortgage Type
Construction
Purchase Details
Closed on
Jan 4, 2021
Sold by
Abel Shannon & Debbie Trust
Bought by
Coe Kevin R and Coe Christine M
Home Financials for this Owner
Home Financials are based on the most recent Mortgage that was taken out on this home.
Original Mortgage
$460,000
Interest Rate
2.7%
Mortgage Type
Construction
Purchase Details
Closed on
Jul 1, 2010
Bought by
Munk James R and Lujan Tami G
Create a Home Valuation Report for This Property
The Home Valuation Report is an in-depth analysis detailing your home's value as well as a comparison with similar homes in the area
Home Values in the Area
Average Home Value in this Area
Purchase History
| Date | Buyer | Sale Price | Title Company |
|---|---|---|---|
| Ttl Properties Llc | -- | None Listed On Document | |
| Leger Timothy Scott Te | $639,367 | Arrowhead Title Co | |
| Coe Kevin R | $575,000 | Integrity Title Solutions Llc | |
| Munk James R | -- | -- |
Source: Public Records
Mortgage History
| Date | Status | Borrower | Loan Amount |
|---|---|---|---|
| Previous Owner | Leger Timothy Scott Te | $511,494 | |
| Previous Owner | Coe Kevin R | $460,000 |
Source: Public Records
Tax History Compared to Growth
Tax History
| Year | Tax Paid | Tax Assessment Tax Assessment Total Assessment is a certain percentage of the fair market value that is determined by local assessors to be the total taxable value of land and additions on the property. | Land | Improvement |
|---|---|---|---|---|
| 2023 | $2,820 | $68,440 | $0 | $0 |
| 2022 | $2,760 | $68,440 | $0 | $0 |
| 2021 | $2,764 | $68,440 | $0 | $0 |
| 2020 | $2,786 | $68,440 | $0 | $0 |
| 2019 | $2,784 | $68,440 | $0 | $0 |
| 2018 | $2,784 | $68,440 | $0 | $0 |
| 2017 | $2,635 | $68,440 | $0 | $0 |
| 2016 | $2,637 | $115,260 | $0 | $0 |
| 2015 | $2,811 | $70,270 | $0 | $0 |
| 2014 | $2,815 | $70,270 | $0 | $0 |
| 2013 | -- | $70,270 | $0 | $0 |
Source: Public Records
Map
Nearby Homes
- Lot 11 Spyglass Cir
- Lot #6 Spyglass Cir
- 0 Twin Rivers Point Unit 3578739
- 11 Claw Dr
- 366 Highlands Dr
- 27 River Stone
- 1072 Jupiter Rd
- 194 View Dr
- 325 Mission Bay Blvd
- 0 Tbd Bear Paw Rd
- 779 Osage Highlands Loop
- 245 Plaza Beach Dr Unit 3C
- 159 & 167 Bermuda Dr
- 2299 Standing Rock Rd
- TBD Plaza Beach Dr
- 290 Plaza Beach Dr Unit 5A
- 290 Plaza Beach Dr Unit 1C
- 290 Plaza Beach Dr Unit 3C
- 290 Plaza Beach Dr Unit 4D
- 290 Plaza Beach Dr Unit 2B
