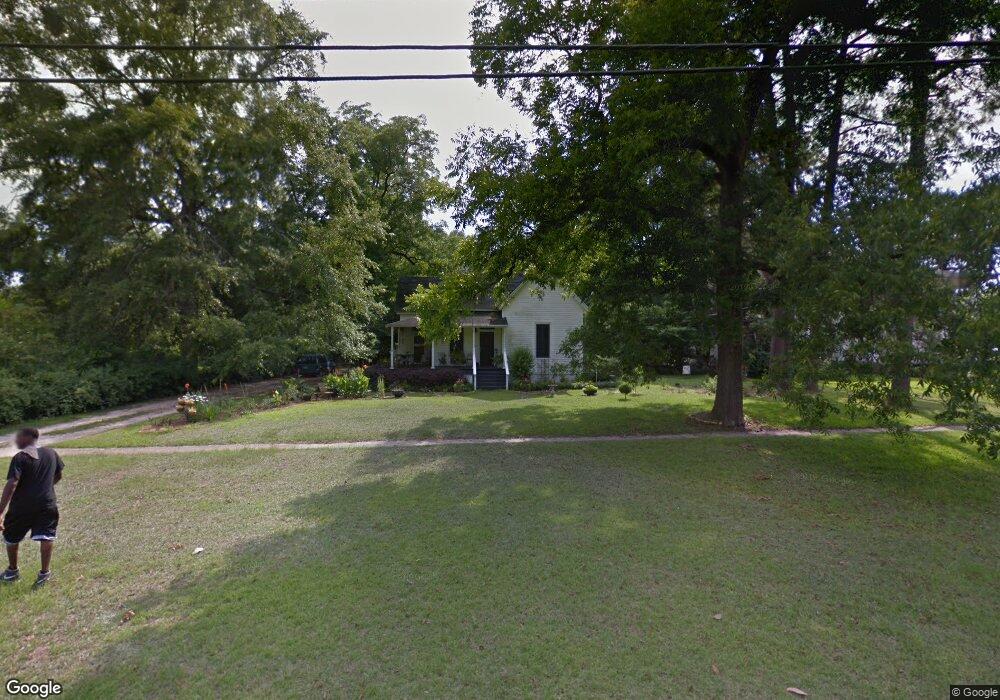
263 Lumpkin St Cuthbert, GA 39840
Estimated Value: $82,000 - $142,000
Studio
2
Baths
1,618
Sq Ft
$65/Sq Ft
Est. Value
About This Home
This home is located at 263 Lumpkin St, Cuthbert, GA 39840 and is currently estimated at $104,584, approximately $64 per square foot. 263 Lumpkin St is a home located in Randolph County with nearby schools including Randolph County Elementary School, Randolph Clay Middle School, and Randolph Clay High School.
Ownership History
Date
Name
Owned For
Owner Type
Purchase Details
Closed on
Mar 24, 2021
Sold by
Addison Hallie
Bought by
Caldwell Sara
Current Estimated Value
Purchase Details
Closed on
Mar 22, 2021
Sold by
Sullivan David
Bought by
Addison Hallie
Purchase Details
Closed on
Oct 14, 2011
Sold by
Sullivan David C
Bought by
Sullivan Joyce M
Purchase Details
Closed on
Aug 15, 2011
Sold by
Wells Fargo Bank Na
Bought by
Sullivan David
Purchase Details
Closed on
Feb 27, 2002
Sold by
Whatley Georgia L
Bought by
Whatley Charles M Et
Purchase Details
Closed on
Jun 3, 1998
Sold by
Whatley Valdah D
Bought by
Whatley Valdah D and Whatley I
Purchase Details
Closed on
Mar 22, 1994
Bought by
Whatley Valdah D
Purchase Details
Closed on
Aug 31, 1992
Bought by
Guest Celeste K
Create a Home Valuation Report for This Property
The Home Valuation Report is an in-depth analysis detailing your home's value as well as a comparison with similar homes in the area
Home Values in the Area
Average Home Value in this Area
Purchase History
| Date | Buyer | Sale Price | Title Company |
|---|---|---|---|
| Caldwell Sara | $70,000 | -- | |
| Caldwell Sara | $70,000 | -- | |
| Addison Hallie | $35,900 | -- | |
| Addison Hallie | $35,900 | -- | |
| Sullivan Joyce M | -- | -- | |
| Sullivan Joyce M | -- | -- | |
| Sullivan David | $28,900 | -- | |
| Sullivan David | $28,900 | -- | |
| Whatley Charles M Et | -- | -- | |
| Whatley Valdah D | -- | -- | |
| Whatley Valdah D | -- | -- | |
| Whatley Valdah D | $49,500 | -- | |
| Whatley Valdah D | $49,500 | -- | |
| Guest Celeste K | $41,000 | -- | |
| Guest Celeste K | $41,000 | -- |
Source: Public Records
Tax History
| Year | Tax Paid | Tax Assessment Tax Assessment Total Assessment is a certain percentage of the fair market value that is determined by local assessors to be the total taxable value of land and additions on the property. | Land | Improvement |
|---|---|---|---|---|
| 2024 | $1,817 | $34,256 | $4,240 | $30,016 |
| 2023 | $1,325 | $34,256 | $4,240 | $30,016 |
| 2022 | $1,253 | $34,256 | $4,240 | $30,016 |
| 2021 | $780 | $20,963 | $3,545 | $17,418 |
| 2020 | $802 | $20,963 | $3,545 | $17,418 |
| 2019 | $797 | $20,963 | $3,545 | $17,418 |
| 2018 | $965 | $20,963 | $3,545 | $17,418 |
| 2017 | $763 | $20,963 | $3,545 | $17,418 |
| 2016 | $765 | $20,964 | $3,545 | $17,418 |
| 2015 | -- | $20,964 | $3,545 | $17,418 |
| 2014 | -- | $22,175 | $3,643 | $18,532 |
| 2013 | -- | $22,175 | $3,642 | $18,532 |
Source: Public Records
Map
Nearby Homes
- 42 W Harris St
- 349 Highland Ave
- 365 Highland Ave
- 396 Hood St
- 140 College St
- 298 Nelson Coffin Dr
- 0 District Line Rd Unit 10518137
- Mattox Rd
- Old Spring Rd
- Cotton Hill Rd
- 0 Benevolence Hwy Unit 26314983
- Pierce Rd
- 3833 US Highway 82
- 223 Deer Run Rd
- 0 County Rd 70
- 886 Mound Rd
- Sam Bentley Rd
- 3016 Clubhouse Rd
- 3437 Us Highway 82
- County Road 186
- 279 Lumpkin St
- 297 Lumpkin St
- 264 Lumpkin St
- 242 Lumpkin St
- 409 Lumpkin St
- 284 Lumpkin St
- 311 Lumpkin St
- 384 Randolph St
- 222 Lumpkin St
- 34 Taylor St
- 306 Lumpkin St
- 002 Benevolence Rd
- 394 Randolph St
- 324 Lumpkin St
- 378 Randolph St
- 332 Lumpkin St
- 339 Lumpkin St
- 19 Taylor St
- 180 Lumpkin St
- 200 W Church St
Your Personal Tour Guide
Ask me questions while you tour the home.