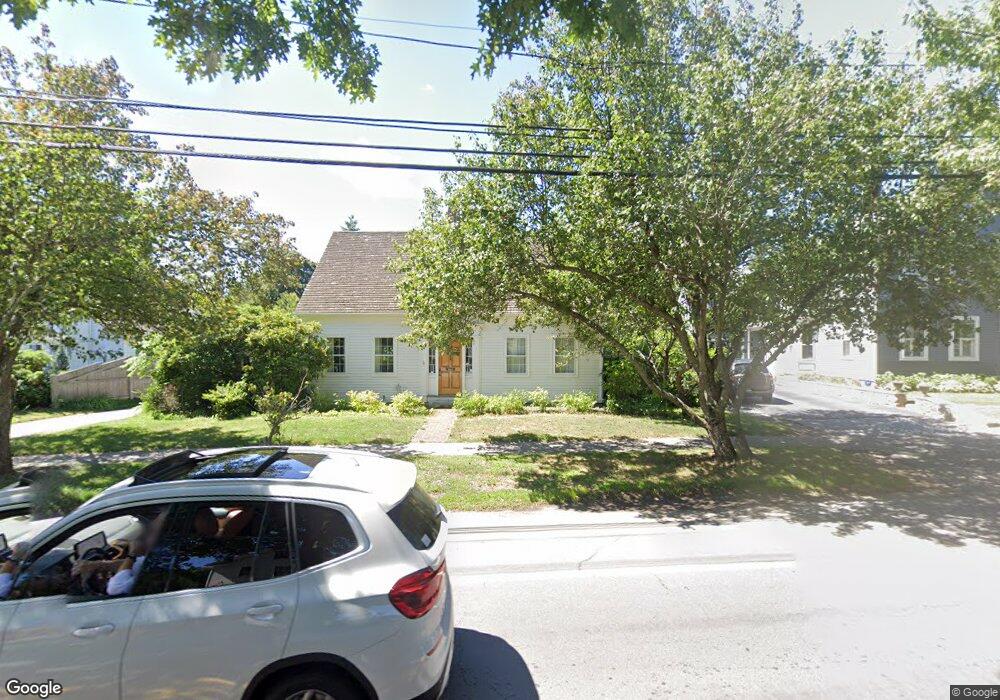
263 Main St Hingham, MA 02043
Estimated Value: $1,214,205 - $1,406,000
3
Beds
3
Baths
2,033
Sq Ft
$659/Sq Ft
Est. Value
About This Home
This home is located at 263 Main St, Hingham, MA 02043 and is currently estimated at $1,339,801, approximately $659 per square foot. 263 Main St is a home located in Plymouth County with nearby schools including East Elementary School, Hingham Middle School, and Hingham High School.
Ownership History
Date
Name
Owned For
Owner Type
Purchase Details
Closed on
Mar 25, 2004
Sold by
Wilkes Hilbert Garriso and Wilkes Hilbert G
Bought by
Wilkes Hilbert Garriso and Wilkes Marie Dalton Gi
Current Estimated Value
Purchase Details
Closed on
Aug 17, 1987
Sold by
Carpenter F Scott
Bought by
Wilkes H Garrison
Home Financials for this Owner
Home Financials are based on the most recent Mortgage that was taken out on this home.
Original Mortgage
$100,000
Interest Rate
10.4%
Mortgage Type
Purchase Money Mortgage
Create a Home Valuation Report for This Property
The Home Valuation Report is an in-depth analysis detailing your home's value as well as a comparison with similar homes in the area
Purchase History
| Date | Buyer | Sale Price | Title Company |
|---|---|---|---|
| Wilkes Hilbert Garriso | -- | -- | |
| Wilkes H Garrison | $292,500 | -- |
Source: Public Records
Mortgage History
| Date | Status | Borrower | Loan Amount |
|---|---|---|---|
| Previous Owner | Wilkes H Garrison | $100,000 | |
| Previous Owner | Wilkes H Garrison | $100,000 |
Source: Public Records
Tax History
| Year | Tax Paid | Tax Assessment Tax Assessment Total Assessment is a certain percentage of the fair market value that is determined by local assessors to be the total taxable value of land and additions on the property. | Land | Improvement |
|---|---|---|---|---|
| 2025 | $11,527 | $1,078,300 | $762,300 | $316,000 |
| 2024 | $11,627 | $1,071,600 | $762,300 | $309,300 |
| 2023 | $10,623 | $1,062,300 | $762,300 | $300,000 |
| 2022 | $10,901 | $943,000 | $693,000 | $250,000 |
| 2021 | $10,563 | $895,200 | $654,500 | $240,700 |
| 2020 | $10,322 | $895,200 | $654,500 | $240,700 |
| 2019 | $10,525 | $891,200 | $654,500 | $236,700 |
| 2018 | $10,411 | $884,500 | $654,500 | $230,000 |
| 2017 | $10,724 | $875,400 | $671,100 | $204,300 |
| 2016 | $10,535 | $843,500 | $639,200 | $204,300 |
| 2015 | $10,816 | $863,200 | $591,900 | $271,300 |
Source: Public Records
Map
Nearby Homes
Your Personal Tour Guide
Ask me questions while you tour the home.