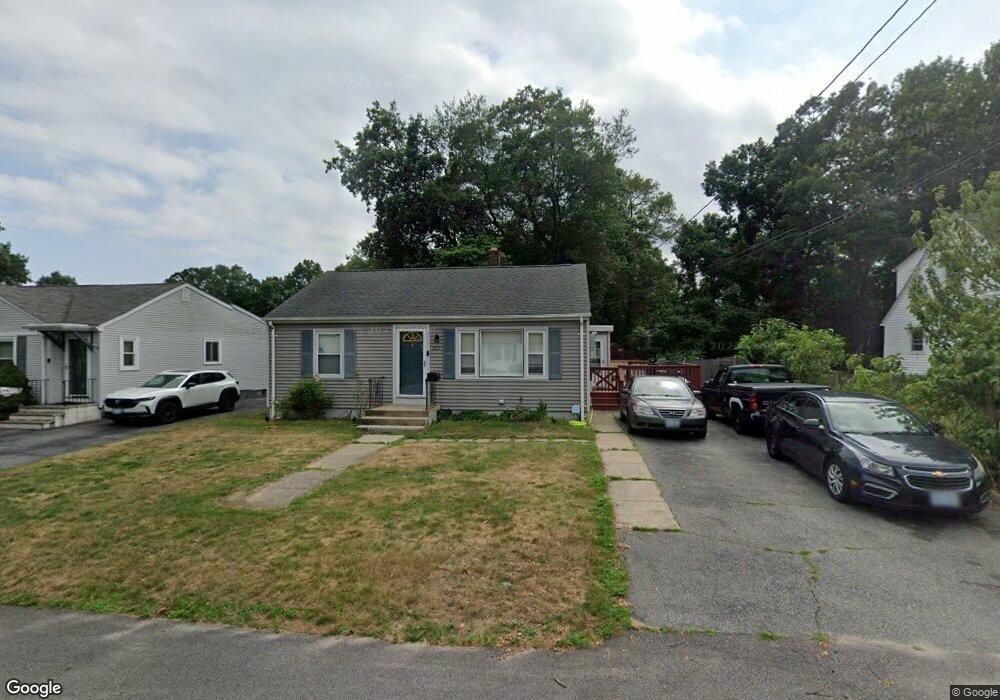
263 Maple St Warwick, RI 02888
Norwood NeighborhoodEstimated Value: $286,000 - $379,000
3
Beds
2
Baths
964
Sq Ft
$349/Sq Ft
Est. Value
About This Home
This home is located at 263 Maple St, Warwick, RI 02888 and is currently estimated at $336,286, approximately $348 per square foot. 263 Maple St is a home located in Kent County with nearby schools including Nel/Cps Construction Career, St. Peter School, and Saint Paul School.
Ownership History
Date
Name
Owned For
Owner Type
Purchase Details
Closed on
Jun 21, 2023
Sold by
Rosa Judith
Bought by
Rose Brian A
Current Estimated Value
Home Financials for this Owner
Home Financials are based on the most recent Mortgage that was taken out on this home.
Original Mortgage
$226,816
Outstanding Balance
$219,725
Interest Rate
6.35%
Mortgage Type
FHA
Estimated Equity
$116,561
Purchase Details
Closed on
Jun 21, 2004
Sold by
Kimatian George R
Bought by
Rosa Judith
Purchase Details
Closed on
Dec 13, 1993
Sold by
Menard Keith R
Bought by
Kimatian George R
Create a Home Valuation Report for This Property
The Home Valuation Report is an in-depth analysis detailing your home's value as well as a comparison with similar homes in the area
Home Values in the Area
Average Home Value in this Area
Purchase History
| Date | Buyer | Sale Price | Title Company |
|---|---|---|---|
| Rose Brian A | $231,000 | None Available | |
| Rosa Judith | $194,000 | -- | |
| Kimatian George R | $82,000 | -- |
Source: Public Records
Mortgage History
| Date | Status | Borrower | Loan Amount |
|---|---|---|---|
| Open | Rose Brian A | $226,816 | |
| Previous Owner | Kimatian George R | $180,030 | |
| Previous Owner | Kimatian George R | $196,425 | |
| Previous Owner | Kimatian George R | $30,000 |
Source: Public Records
Tax History
| Year | Tax Paid | Tax Assessment Tax Assessment Total Assessment is a certain percentage of the fair market value that is determined by local assessors to be the total taxable value of land and additions on the property. | Land | Improvement |
|---|---|---|---|---|
| 2025 | $3,970 | $312,600 | $101,100 | $211,500 |
| 2024 | $3,820 | $264,000 | $87,900 | $176,100 |
| 2023 | $3,746 | $264,000 | $87,900 | $176,100 |
| 2022 | $3,555 | $189,800 | $56,900 | $132,900 |
| 2021 | $3,555 | $189,800 | $56,900 | $132,900 |
| 2020 | $3,555 | $189,800 | $56,900 | $132,900 |
| 2019 | $3,555 | $189,800 | $56,900 | $132,900 |
| 2018 | $2,970 | $142,800 | $56,900 | $85,900 |
| 2017 | $2,890 | $142,800 | $56,900 | $85,900 |
| 2016 | $2,890 | $142,800 | $56,900 | $85,900 |
| 2015 | $2,807 | $135,300 | $55,800 | $79,500 |
| 2014 | $2,714 | $135,300 | $55,800 | $79,500 |
| 2013 | $2,678 | $135,300 | $55,800 | $79,500 |
Source: Public Records
Map
Nearby Homes
- 175 Pettaconsett Ave
- 22 Phillips Ave
- 35 Welfare Ave
- 1052 Post Rd
- 90 Massachusetts Ave
- 77 Kentucky Ave
- 123 Harrington Ave
- 0 Elmwood Ave
- 213 Easton Ave
- 150 Riverside Ave
- 80 George St
- 821 Post Rd
- 39 Holiday Ave
- 859 Pontiac Ave
- 127 Dellwood Rd
- 103 Harper Ave
- 15 Christopher Rhodes Way
- 6 Christopher Rhodes Way
- 167 Forest Ave
- 64 Holburn Ave
Your Personal Tour Guide
Ask me questions while you tour the home.