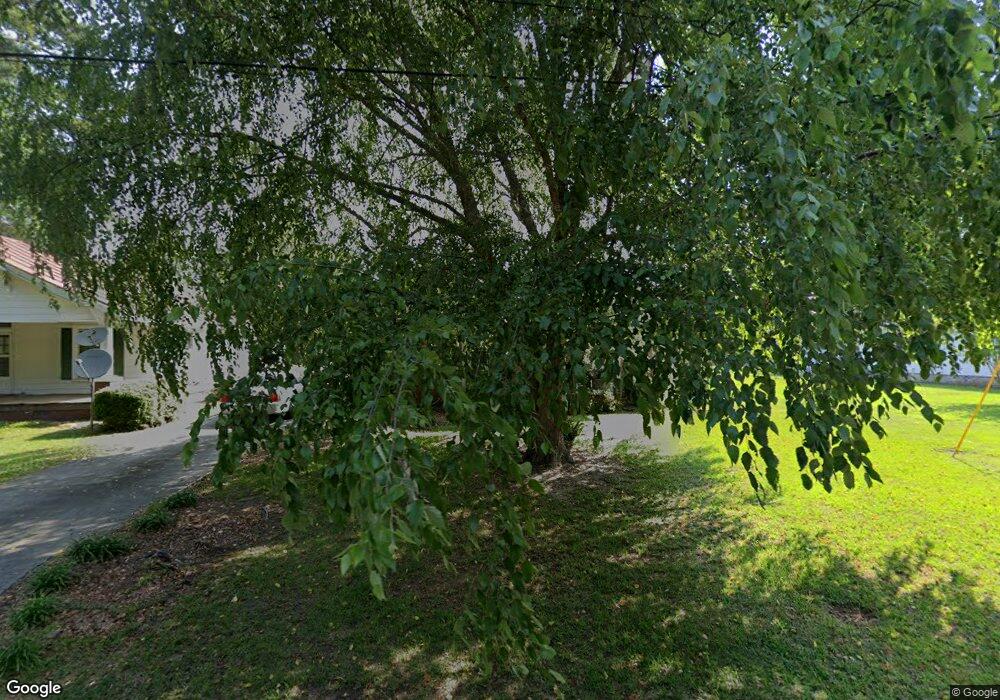
263 Mccrae St Grifton, NC 28530
Estimated Value: $184,000 - $231,000
3
Beds
2
Baths
2,008
Sq Ft
$106/Sq Ft
Est. Value
About This Home
This home is located at 263 Mccrae St, Grifton, NC 28530 and is currently estimated at $213,487, approximately $106 per square foot. 263 Mccrae St is a home located in Pitt County with nearby schools including Grifton and Ayden-Grifton High School.
Ownership History
Date
Name
Owned For
Owner Type
Purchase Details
Closed on
Sep 11, 2025
Sold by
Hudson George William and Hudson Catherine Helen
Bought by
Hudson Family Living Trust and Hudson
Current Estimated Value
Purchase Details
Closed on
Jul 26, 2024
Sold by
Hudson Tyson Wanda
Bought by
Hudson George William
Purchase Details
Closed on
Aug 7, 2023
Sold by
Hudson Nellie Stancil
Bought by
Tyson Wanda Hudson
Purchase Details
Closed on
Jul 5, 2023
Sold by
Hudson Nellie Stancil
Bought by
Tyson Wanda Hudson
Purchase Details
Closed on
Jan 10, 2014
Sold by
Holland George Patrick
Bought by
Stancil Holland Nellie
Create a Home Valuation Report for This Property
The Home Valuation Report is an in-depth analysis detailing your home's value as well as a comparison with similar homes in the area
Home Values in the Area
Average Home Value in this Area
Purchase History
| Date | Buyer | Sale Price | Title Company |
|---|---|---|---|
| Hudson Family Living Trust | -- | None Listed On Document | |
| Hudson George William | -- | None Listed On Document | |
| Hudson George William | -- | None Listed On Document | |
| Tyson Wanda Hudson | -- | None Listed On Document | |
| Tyson Wanda Hudson | -- | None Listed On Document | |
| Stancil Holland Nellie | -- | None Available |
Source: Public Records
Tax History
| Year | Tax Paid | Tax Assessment Tax Assessment Total Assessment is a certain percentage of the fair market value that is determined by local assessors to be the total taxable value of land and additions on the property. | Land | Improvement |
|---|---|---|---|---|
| 2025 | $1,303 | $185,222 | $15,000 | $170,222 |
| 2024 | $1,291 | $185,222 | $15,000 | $170,222 |
| 2023 | $602 | $126,369 | $12,000 | $114,369 |
| 2022 | $590 | $126,369 | $12,000 | $114,369 |
| 2021 | $587 | $126,369 | $12,000 | $114,369 |
| 2020 | $591 | $126,369 | $12,000 | $114,369 |
| 2019 | $777 | $90,415 | $12,000 | $78,415 |
| 2018 | $742 | $90,415 | $12,000 | $78,415 |
| 2017 | $739 | $90,415 | $12,000 | $78,415 |
| 2016 | $733 | $90,415 | $12,000 | $78,415 |
| 2015 | $847 | $106,894 | $12,000 | $94,894 |
| 2014 | $847 | $106,894 | $12,000 | $94,894 |
Source: Public Records
Map
Nearby Homes
- 6735 Hill St
- 0 N Carolina 118
- 6748 Pitt St
- 0 Water St Unit 100531999
- 548 Cannon Blvd
- 158 Contentnea Dr
- 0 Unit 100521949
- 6602 Pollock Ct
- 714 Pope St
- 708 Pope St
- 709 Pope St
- 685 Saint Joseph St
- 694 Pope St
- 702 Pope St
- 767 Wall St
- 0 Birch Rd Unit 100538515
- 716 Birch Rd
- 710 Birch Rd
- 0 Grifton Hugo Rd
- 6529 Dogwood Ln
Your Personal Tour Guide
Ask me questions while you tour the home.