Estimated Value: $198,000 - $234,000
--
Bed
--
Bath
979
Sq Ft
$214/Sq Ft
Est. Value
About This Home
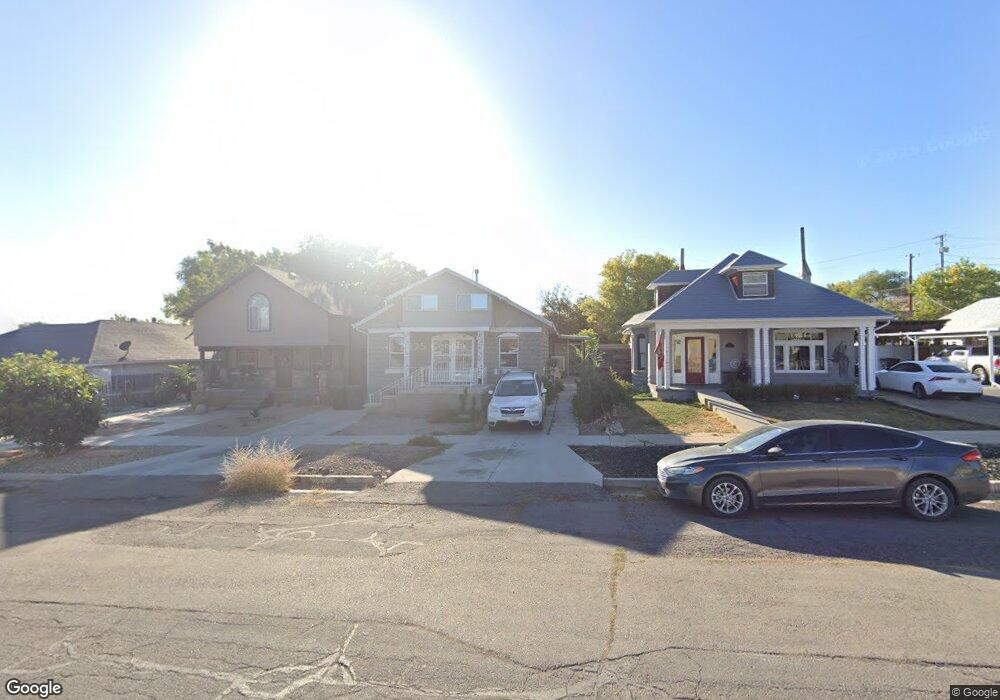
This home is located at 263 N 100 W, Price, UT 84501 and is currently estimated at $209,831, approximately $214 per square foot. 263 N 100 W is a home located in Carbon County with nearby schools including Castle Heights School, Mont Harmon Junior High School, and Carbon High School.
Ownership History
Date
Name
Owned For
Owner Type
Purchase Details
Closed on
Aug 7, 2020
Sold by
Arnette Carole B
Bought by
Meldrum Christie
Current Estimated Value
Home Financials for this Owner
Home Financials are based on the most recent Mortgage that was taken out on this home.
Original Mortgage
$130,494
Outstanding Balance
$115,455
Interest Rate
3.1%
Mortgage Type
Credit Line Revolving
Estimated Equity
$94,376
Purchase Details
Closed on
May 31, 2017
Sold by
Arnette Carole B and Estate Of David Everest Arnett
Bought by
Arnette Carole B
Create a Home Valuation Report for This Property
The Home Valuation Report is an in-depth analysis detailing your home's value as well as a comparison with similar homes in the area
Home Values in the Area
Average Home Value in this Area
Purchase History
| Date | Buyer | Sale Price | Title Company |
|---|---|---|---|
| Meldrum Christie | -- | South Eastern Utah Ttl Compa | |
| Arnette Carole B | -- | None Available | |
| Estate Of David Everest Arnette | -- | None Available |
Source: Public Records
Mortgage History
| Date | Status | Borrower | Loan Amount |
|---|---|---|---|
| Open | Meldrum Christie | $130,494 |
Source: Public Records
Tax History Compared to Growth
Tax History
| Year | Tax Paid | Tax Assessment Tax Assessment Total Assessment is a certain percentage of the fair market value that is determined by local assessors to be the total taxable value of land and additions on the property. | Land | Improvement |
|---|---|---|---|---|
| 2025 | $593 | $48,845 | $6,136 | $42,709 |
| 2024 | $1,006 | $83,788 | $16,500 | $67,288 |
| 2023 | $1,140 | $101,181 | $9,442 | $91,739 |
| 2022 | $1,190 | $94,804 | $7,851 | $86,953 |
| 2021 | $1,024 | $126,557 | $11,995 | $114,562 |
| 2020 | $1,004 | $62,318 | $0 | $0 |
| 2019 | $894 | $58,158 | $0 | $0 |
| 2018 | $801 | $53,160 | $0 | $0 |
| 2017 | $791 | $53,160 | $0 | $0 |
| 2016 | $714 | $53,160 | $0 | $0 |
| 2015 | $714 | $53,160 | $0 | $0 |
| 2014 | $709 | $53,160 | $0 | $0 |
| 2013 | $539 | $40,071 | $0 | $0 |
Source: Public Records
Map
Nearby Homes