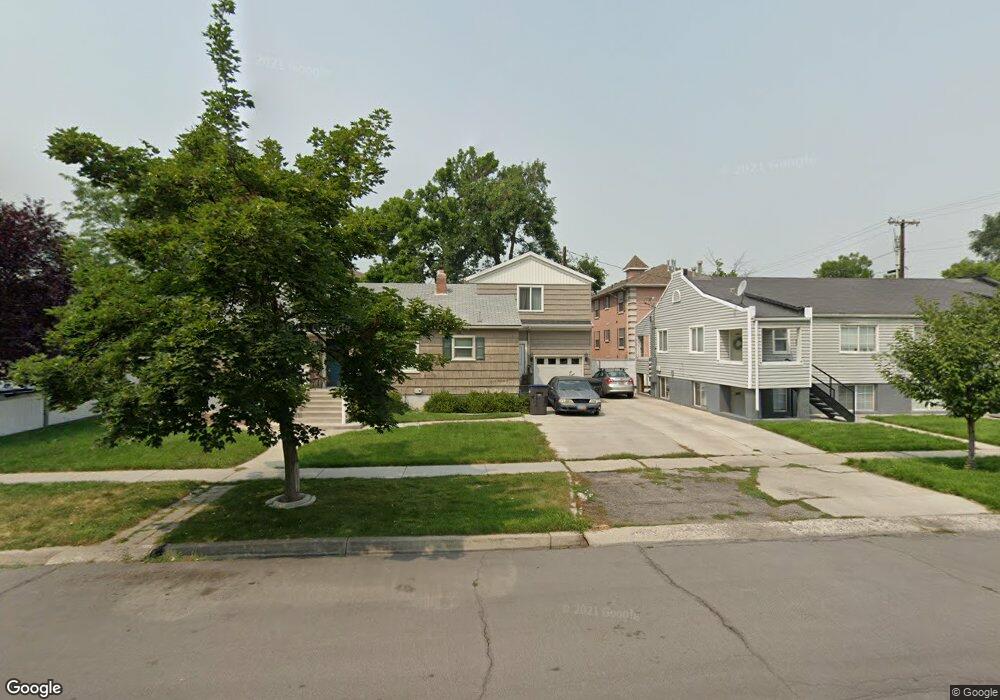
263 N 300 W Unit 25 Provo, UT 84601
Rivergrove NeighborhoodEstimated Value: $267,000 - $282,000
2
Beds
1
Bath
763
Sq Ft
$361/Sq Ft
Est. Value
About This Home
This home is located at 263 N 300 W Unit 25, Provo, UT 84601 and is currently estimated at $275,334, approximately $360 per square foot. 263 N 300 W Unit 25 is a home located in Utah County with nearby schools including Timpanogos Elementary School, Dixon Middle School, and Provo High School.
Ownership History
Date
Name
Owned For
Owner Type
Purchase Details
Closed on
Mar 11, 2021
Sold by
Winward Michael Paul and Winward Cynthia
Bought by
Winward M Paul M and Winward Cynthia
Current Estimated Value
Purchase Details
Closed on
Jun 1, 2020
Sold by
Lexington 25 Llc
Bought by
Winward Michael Paul and Winward Cynthia
Home Financials for this Owner
Home Financials are based on the most recent Mortgage that was taken out on this home.
Original Mortgage
$142,125
Outstanding Balance
$125,983
Interest Rate
3.2%
Mortgage Type
New Conventional
Estimated Equity
$149,351
Purchase Details
Closed on
Jul 1, 2011
Sold by
Knowles Graham J and Knowles Yvonne M
Bought by
Lexington 25 Llc
Purchase Details
Closed on
Aug 18, 2005
Sold by
Liddle Joseph D and Liddle Judith C
Bought by
Knowles Graham J and Knowles Yvonne M
Home Financials for this Owner
Home Financials are based on the most recent Mortgage that was taken out on this home.
Original Mortgage
$91,675
Interest Rate
5.56%
Mortgage Type
Fannie Mae Freddie Mac
Create a Home Valuation Report for This Property
The Home Valuation Report is an in-depth analysis detailing your home's value as well as a comparison with similar homes in the area
Home Values in the Area
Average Home Value in this Area
Purchase History
| Date | Buyer | Sale Price | Title Company |
|---|---|---|---|
| Winward M Paul M | -- | None Available | |
| Winward Michael Paul | -- | Investors Title Ins Agcy Inc | |
| Lexington 25 Llc | -- | Cornerstone Title Insurance | |
| Knowles Graham J | -- | First American Title Agency |
Source: Public Records
Mortgage History
| Date | Status | Borrower | Loan Amount |
|---|---|---|---|
| Open | Winward Michael Paul | $142,125 | |
| Previous Owner | Knowles Graham J | $91,675 |
Source: Public Records
Tax History Compared to Growth
Tax History
| Year | Tax Paid | Tax Assessment Tax Assessment Total Assessment is a certain percentage of the fair market value that is determined by local assessors to be the total taxable value of land and additions on the property. | Land | Improvement |
|---|---|---|---|---|
| 2025 | $1,380 | $146,795 | $29,700 | $237,200 |
| 2024 | $1,380 | $135,850 | $0 | $0 |
| 2023 | $1,382 | $134,145 | $0 | $0 |
| 2022 | $1,350 | $132,055 | $0 | $0 |
| 2021 | $1,134 | $193,600 | $23,200 | $170,400 |
| 2020 | $1,119 | $179,000 | $21,500 | $157,500 |
| 2019 | $974 | $162,000 | $21,000 | $141,000 |
| 2018 | $853 | $144,000 | $18,000 | $126,000 |
| 2017 | $801 | $74,250 | $0 | $0 |
| 2016 | $751 | $64,900 | $0 | $0 |
| 2015 | $680 | $59,400 | $0 | $0 |
| 2014 | $652 | $59,400 | $0 | $0 |
Source: Public Records
Map
Nearby Homes
- 263 N 300 W
- 263 N 300 W
- 263 N 300 W
- 263 N 300 W
- 263 N 300 W Unit 22
- 263 N 300 W
- 263 N 300 W Unit 26
- 263 N 300 W Unit 23
- 259 N 300 W Unit 32
- 259 N 300 W Unit 31
- 259 N 300 W
- 259 N 300 W Unit 29
- 259 N 300 W Unit 28
- 259 N 300 W
- 259 N 300 W Unit 33
- 259 N 300 W Unit 30
- 327 W 300 N Unit 20
- 327 W 300 N Unit 19
- 327 W 300 N
- 327 W 300 N