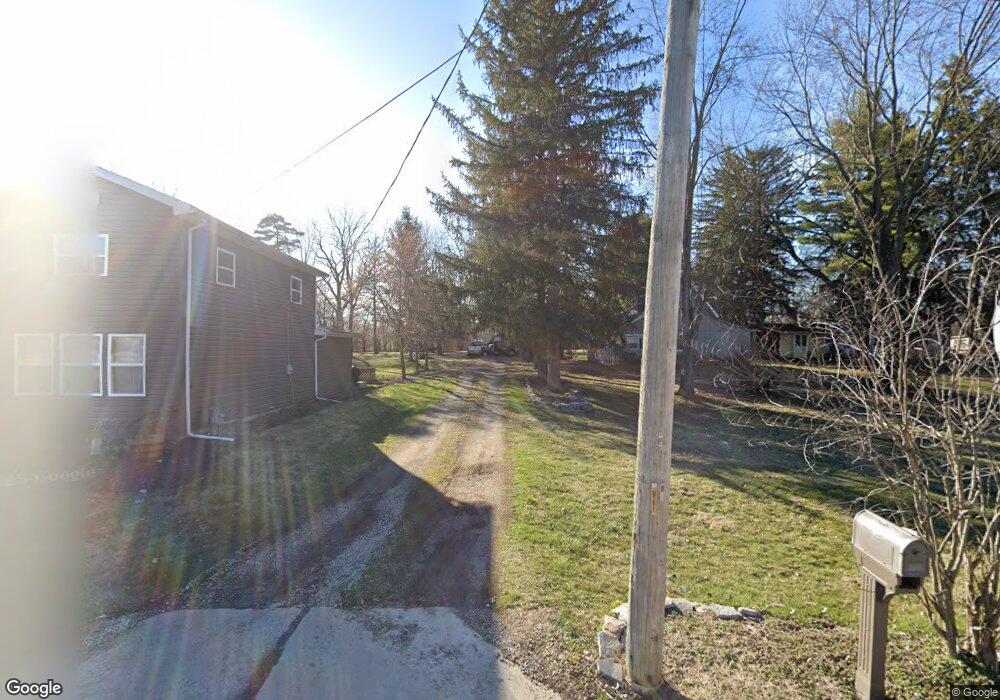
263 N Cherry St Marysville, OH 43040
Estimated Value: $245,000 - $282,252
4
Beds
1
Bath
1,840
Sq Ft
$144/Sq Ft
Est. Value
About This Home
This home is located at 263 N Cherry St, Marysville, OH 43040 and is currently estimated at $265,063, approximately $144 per square foot. 263 N Cherry St is a home located in Union County with nearby schools including Navin Elementary School, Creekview Intermediate Elementary School, and Bunsold Middle School.
Ownership History
Date
Name
Owned For
Owner Type
Purchase Details
Closed on
Sep 6, 2022
Sold by
Shoemaker Michael Allen
Bought by
Shoemaker Michael Allen
Current Estimated Value
Purchase Details
Closed on
Mar 24, 2005
Sold by
Abbey Deborah A and Misplon James R
Bought by
Shoemaker Michael A and Shoemaker Carol A
Home Financials for this Owner
Home Financials are based on the most recent Mortgage that was taken out on this home.
Original Mortgage
$119,000
Interest Rate
5.61%
Mortgage Type
Purchase Money Mortgage
Create a Home Valuation Report for This Property
The Home Valuation Report is an in-depth analysis detailing your home's value as well as a comparison with similar homes in the area
Home Values in the Area
Average Home Value in this Area
Purchase History
| Date | Buyer | Sale Price | Title Company |
|---|---|---|---|
| Shoemaker Michael Allen | -- | None Listed On Document | |
| Shoemaker Michael A | $115,000 | -- |
Source: Public Records
Mortgage History
| Date | Status | Borrower | Loan Amount |
|---|---|---|---|
| Previous Owner | Shoemaker Michael A | $119,000 |
Source: Public Records
Tax History Compared to Growth
Tax History
| Year | Tax Paid | Tax Assessment Tax Assessment Total Assessment is a certain percentage of the fair market value that is determined by local assessors to be the total taxable value of land and additions on the property. | Land | Improvement |
|---|---|---|---|---|
| 2024 | $2,179 | $52,200 | $16,870 | $35,330 |
| 2023 | $2,179 | $52,200 | $16,870 | $35,330 |
| 2022 | $2,139 | $52,200 | $16,870 | $35,330 |
| 2021 | $2,313 | $49,320 | $12,980 | $36,340 |
| 2020 | $2,309 | $49,320 | $12,980 | $36,340 |
| 2019 | $2,337 | $49,320 | $12,980 | $36,340 |
| 2018 | $1,797 | $35,330 | $9,910 | $25,420 |
| 2017 | $1,758 | $35,330 | $9,910 | $25,420 |
| 2016 | $1,752 | $35,330 | $9,910 | $25,420 |
| 2015 | $1,595 | $30,080 | $9,910 | $20,170 |
| 2014 | $1,595 | $30,080 | $9,910 | $20,170 |
| 2013 | $1,501 | $30,080 | $9,910 | $20,170 |
Source: Public Records
Map
Nearby Homes
- 627 E 6th St
- 125 S Oak St
- 158C Tulip Dr
- 226 S Plum St
- 78 Aspen Dr
- 203 W 3rd St
- 0 Square Dr
- 718 N Main St
- 256 W 3rd St
- 260 W 4th St
- 0 Columbus Ave
- 569 E 10th St Unit 1A
- 226 Elwood Ave
- 448 Professional Pkwy
- 525 Ash St
- 733 N Maple St
- 15760 Watkins Rd
- 651 Millcrest Dr Unit 651A
- 564 Summer Tree Loop
- 382 Moss Ct