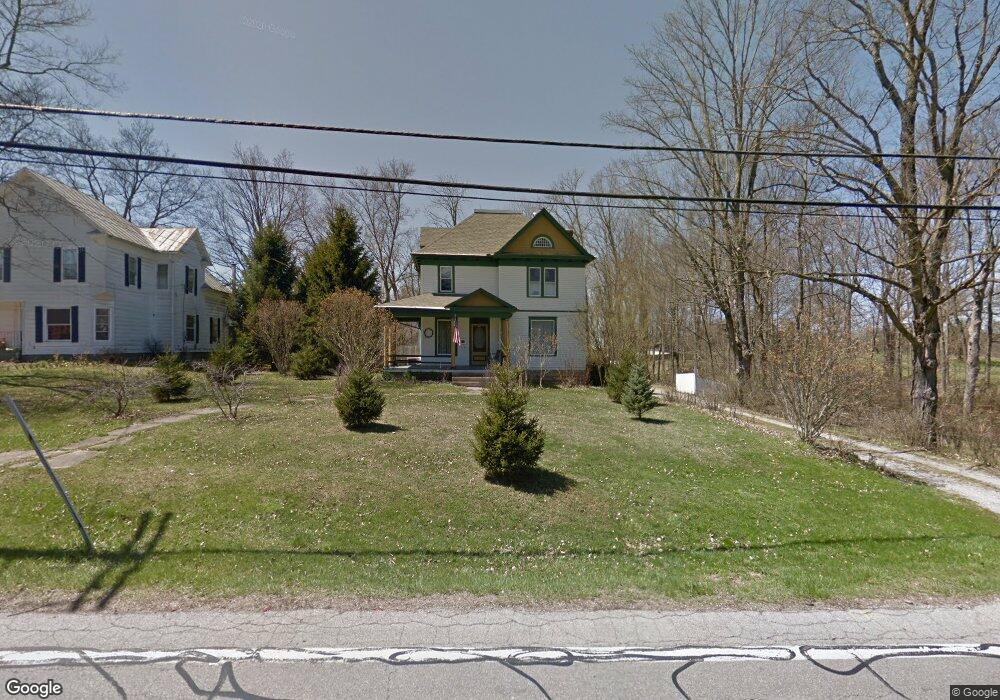
263 N Main St Mount Gilead, OH 43338
Estimated Value: $238,000 - $289,000
4
Beds
1
Bath
2,560
Sq Ft
$101/Sq Ft
Est. Value
About This Home
This home is located at 263 N Main St, Mount Gilead, OH 43338 and is currently estimated at $258,875, approximately $101 per square foot. 263 N Main St is a home located in Morrow County with nearby schools including Park Avenue Elementary School, Mt Gilead Middle School, and Mt Gilead High School.
Ownership History
Date
Name
Owned For
Owner Type
Purchase Details
Closed on
Sep 5, 2008
Sold by
Teacher Richard and Teacher Mariann
Bought by
Teacher Gerald F
Current Estimated Value
Purchase Details
Closed on
Nov 13, 2003
Sold by
Richendollar Sylvia R
Bought by
Teacher Richard and Teacher Mariann
Purchase Details
Closed on
Oct 25, 1996
Bought by
Richendollar Sylvia R
Create a Home Valuation Report for This Property
The Home Valuation Report is an in-depth analysis detailing your home's value as well as a comparison with similar homes in the area
Home Values in the Area
Average Home Value in this Area
Purchase History
| Date | Buyer | Sale Price | Title Company |
|---|---|---|---|
| Teacher Gerald F | $158,100 | -- | |
| Teacher Richard | $135,000 | -- | |
| Richendollar Sylvia R | $98,000 | -- |
Source: Public Records
Tax History
| Year | Tax Paid | Tax Assessment Tax Assessment Total Assessment is a certain percentage of the fair market value that is determined by local assessors to be the total taxable value of land and additions on the property. | Land | Improvement |
|---|---|---|---|---|
| 2025 | $2,624 | $66,010 | $14,280 | $51,730 |
| 2024 | $2,901 | $66,010 | $14,280 | $51,730 |
| 2023 | $2,901 | $66,010 | $14,280 | $51,730 |
| 2022 | $2,501 | $50,970 | $11,240 | $39,730 |
| 2021 | $2,379 | $50,970 | $11,240 | $39,730 |
| 2020 | $2,381 | $50,970 | $11,240 | $39,730 |
| 2019 | $2,099 | $44,320 | $9,770 | $34,550 |
| 2018 | $2,100 | $44,320 | $9,770 | $34,550 |
| 2017 | $2,069 | $44,320 | $9,770 | $34,550 |
| 2016 | $1,985 | $42,220 | $8,790 | $33,430 |
| 2015 | $1,858 | $42,220 | $8,790 | $33,430 |
| 2014 | $1,885 | $42,220 | $8,790 | $33,430 |
| 2013 | $1,984 | $46,910 | $9,770 | $37,140 |
Source: Public Records
Map
Nearby Homes
- 0 Tamarack Unit 223034150
- 148 N Walnut St
- 4926 U S Highway 42
- 202 Iberia St
- 52 N Main St
- 0 Iberia St
- 473 N Delaware St
- 85 S Cherry St
- 251 Lincoln Ave
- 250 S Main St
- 618 Grant St
- 5537 US Highway 42
- 329 W High St
- 614 Buckeye Ln
- 5720 County Road 30
- 5555 U S 42
- 5280 Township Road 103
- 3341 Township Highway 145
- 0 Township Road 145 Lot A Unit 9070485
- 0 Township Road 145 Lot A Unit 20260081
- 257 N Main St
- 258 N Main St
- 249 N Main St
- 249-245 N Main St
- 254 N Main St
- 250 N Main St
- 270 N Main St
- 237 N Main St
- 290 N Cherry St
- 280 N Cherry St
- 284 N Main St
- 234 N Main St
- 290 N Main St
- 231 N Main St
- 270 N Cherry St
- 6742 State Route 61
- 9267 State Route 61
- 1152 State Route 61
- 5937 State Route 61
- 5985 State Route 61
Your Personal Tour Guide
Ask me questions while you tour the home.