--
Bed
--
Bath
2,701
Sq Ft
0.75
Acres
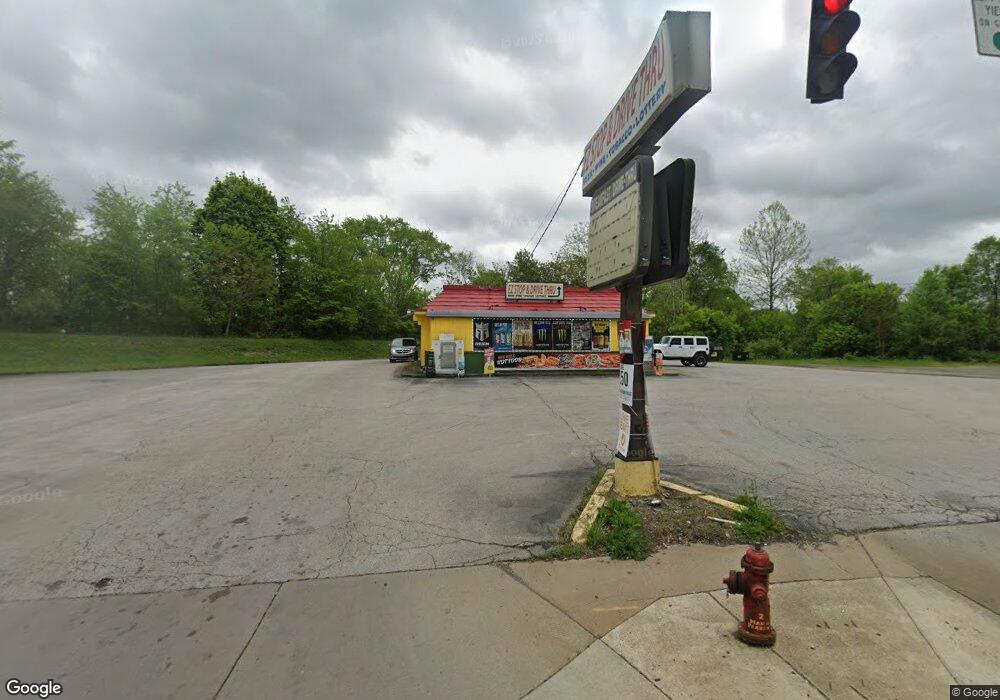
About This Home
This home is located at 263 N Main St, Niles, OH 44446. 263 N Main St is a home located in Trumbull County with nearby schools including Niles Primary School, Niles Intermediate School, and Niles Middle School.
Ownership History
Date
Name
Owned For
Owner Type
Purchase Details
Closed on
Feb 11, 2022
Sold by
Ishaan Llc
Bought by
Singhghotra Llc
Purchase Details
Closed on
Jan 31, 2022
Sold by
Singhghotra Llc
Bought by
Singhghotra Llc
Purchase Details
Closed on
Aug 17, 2015
Sold by
Cross Thomas E and Cross Kitty R
Bought by
Ishaan Llc
Home Financials for this Owner
Home Financials are based on the most recent Mortgage that was taken out on this home.
Original Mortgage
$175,000
Interest Rate
4.03%
Mortgage Type
Commercial
Purchase Details
Closed on
Oct 15, 2002
Sold by
Rose Wade George and Searey Mary Diane
Bought by
Cross Thomas E and Cross Kitty R
Purchase Details
Closed on
Jan 1, 1990
Bought by
Wade D Rose
Create a Home Valuation Report for This Property
The Home Valuation Report is an in-depth analysis detailing your home's value as well as a comparison with similar homes in the area
Home Values in the Area
Average Home Value in this Area
Purchase History
| Date | Buyer | Sale Price | Title Company |
|---|---|---|---|
| Singhghotra Llc | $660 | None Listed On Document | |
| Singhghotra Llc | -- | None Listed On Document | |
| Ishaan Llc | $160,000 | Attorney | |
| Cross Thomas E | $160,000 | -- | |
| Wade D Rose | -- | -- |
Source: Public Records
Mortgage History
| Date | Status | Borrower | Loan Amount |
|---|---|---|---|
| Previous Owner | Ishaan Llc | $175,000 |
Source: Public Records
Tax History Compared to Growth
Tax History
| Year | Tax Paid | Tax Assessment Tax Assessment Total Assessment is a certain percentage of the fair market value that is determined by local assessors to be the total taxable value of land and additions on the property. | Land | Improvement |
|---|---|---|---|---|
| 2024 | $2,854 | $54,640 | $25,870 | $28,770 |
| 2023 | $2,854 | $47,080 | $18,310 | $28,770 |
| 2022 | $2,881 | $47,050 | $18,310 | $28,740 |
| 2021 | $3,013 | $47,050 | $18,310 | $28,740 |
| 2020 | $3,095 | $47,050 | $18,310 | $28,740 |
| 2019 | $3,138 | $47,050 | $18,310 | $28,740 |
| 2018 | $3,119 | $47,050 | $18,310 | $28,740 |
| 2017 | $3,087 | $47,050 | $18,310 | $28,740 |
| 2016 | $3,061 | $47,470 | $16,280 | $31,190 |
| 2015 | $3,040 | $47,470 | $16,280 | $31,190 |
| 2014 | $3,034 | $47,470 | $16,280 | $31,190 |
| 2013 | $2,936 | $47,470 | $16,280 | $31,190 |
Source: Public Records
Map
Nearby Homes
- 158 N Arlington Ave
- 0 Federal
- 22 N Arlington Ave
- 512 John St
- 240 Warren Ave
- 323 W State St
- 46 & 48 Hyde Ave
- 409 West St
- 512 W Federal St
- 322 Morse Ave
- 416 N Cedar Ave
- 4,6,8 Lafayette
- 611 Mason St
- 719 Robbins Ave
- 145 North Rd
- 719 Lafayette Ave
- 17 Belmont Ave
- 39 Belmont Ave
- 816 Fenton St
- 839 Robbins Ave