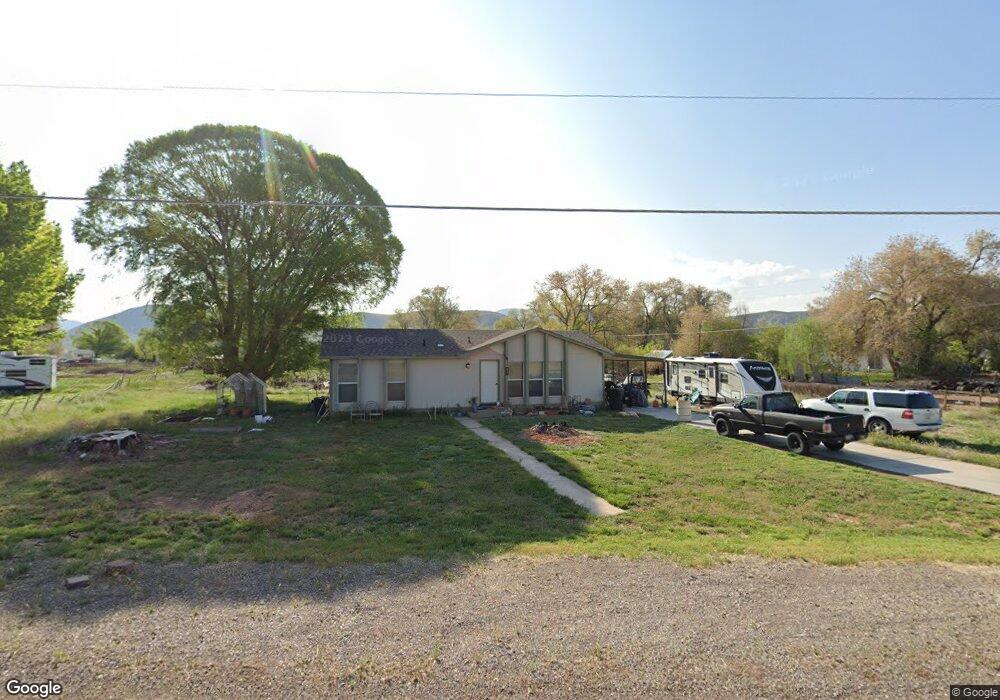
263 S Canal Rd Sigurd, UT 84657
Estimated Value: $216,774 - $302,000
2
Beds
1
Bath
1,056
Sq Ft
$244/Sq Ft
Est. Value
About This Home
This home is located at 263 S Canal Rd, Sigurd, UT 84657 and is currently estimated at $257,944, approximately $244 per square foot. 263 S Canal Rd is a home located in Sevier County with nearby schools including Pahvant School, Ashman School, and Red Hills Middle School.
Ownership History
Date
Name
Owned For
Owner Type
Purchase Details
Closed on
Feb 25, 2020
Sold by
Thompson Darrell and Thompson Lori
Bought by
Thompson Jordan R and Thompson Brooke
Current Estimated Value
Home Financials for this Owner
Home Financials are based on the most recent Mortgage that was taken out on this home.
Original Mortgage
$95,959
Outstanding Balance
$85,146
Interest Rate
3.6%
Mortgage Type
New Conventional
Estimated Equity
$172,798
Purchase Details
Closed on
May 9, 2018
Sold by
Jp Morgan Chase Bank Na
Bought by
Thompson Darrell and Thompson Lori
Purchase Details
Closed on
Feb 23, 2018
Sold by
Torgersen Travis N and Torgersen Kendra
Bought by
Jp Morgan Chase Bank
Purchase Details
Closed on
Oct 19, 2009
Sold by
Allred Shelly M
Bought by
Trogersen Travis N and Trogersen Kendra
Home Financials for this Owner
Home Financials are based on the most recent Mortgage that was taken out on this home.
Original Mortgage
$106,080
Interest Rate
5%
Mortgage Type
New Conventional
Create a Home Valuation Report for This Property
The Home Valuation Report is an in-depth analysis detailing your home's value as well as a comparison with similar homes in the area
Home Values in the Area
Average Home Value in this Area
Purchase History
| Date | Buyer | Sale Price | Title Company |
|---|---|---|---|
| Thompson Jordan R | -- | Eagle Gate Ttl Ins Agcy Inc | |
| Thompson Darrell | $76,000 | Servicelink | |
| Jp Morgan Chase Bank | $85,600 | Utah Title | |
| Trogersen Travis N | -- | Utah Title & Abs |
Source: Public Records
Mortgage History
| Date | Status | Borrower | Loan Amount |
|---|---|---|---|
| Open | Thompson Jordan R | $95,959 | |
| Previous Owner | Trogersen Travis N | $106,080 |
Source: Public Records
Tax History Compared to Growth
Tax History
| Year | Tax Paid | Tax Assessment Tax Assessment Total Assessment is a certain percentage of the fair market value that is determined by local assessors to be the total taxable value of land and additions on the property. | Land | Improvement |
|---|---|---|---|---|
| 2024 | $780 | $97,960 | $23,999 | $73,961 |
| 2023 | $855 | $105,552 | $22,870 | $82,682 |
| 2022 | $838 | $83,633 | $19,490 | $64,143 |
| 2021 | $957 | $80,225 | $19,490 | $60,735 |
| 2020 | $680 | $53,169 | $11,905 | $41,264 |
| 2019 | $611 | $51,020 | $11,910 | $39,110 |
| 2018 | $592 | $80,060 | $20,610 | $59,450 |
| 2017 | $587 | $41,800 | $11,340 | $30,460 |
| 2016 | $465 | $39,310 | $0 | $0 |
| 2015 | $465 | $39,310 | $0 | $0 |
| 2014 | $465 | $38,690 | $0 | $0 |
Source: Public Records
Map
Nearby Homes
- 180 N State St
- 1800 N Vermillion Canal Rd
- 2220 N State St Unit 14
- 305 E 2690 N
- 575 S 205 W
- 1526 N Black Knoll Rd
- 154 E 950 N
- 2330 2650 E
- 110 N 400 E
- 140 N 200 E
- 61 E 100 North St
- 330 W 800 S Unit 105
- 680 E 300 S Unit 110
- 310 W 800 S Unit 106
- 2200 N Hwy 260 (Approximately) W
- 2203 S 1770 W Unit 1
- 79 S 250 E
- 931 N 2270 E
- 60 S Main St
- 155 W 350 S