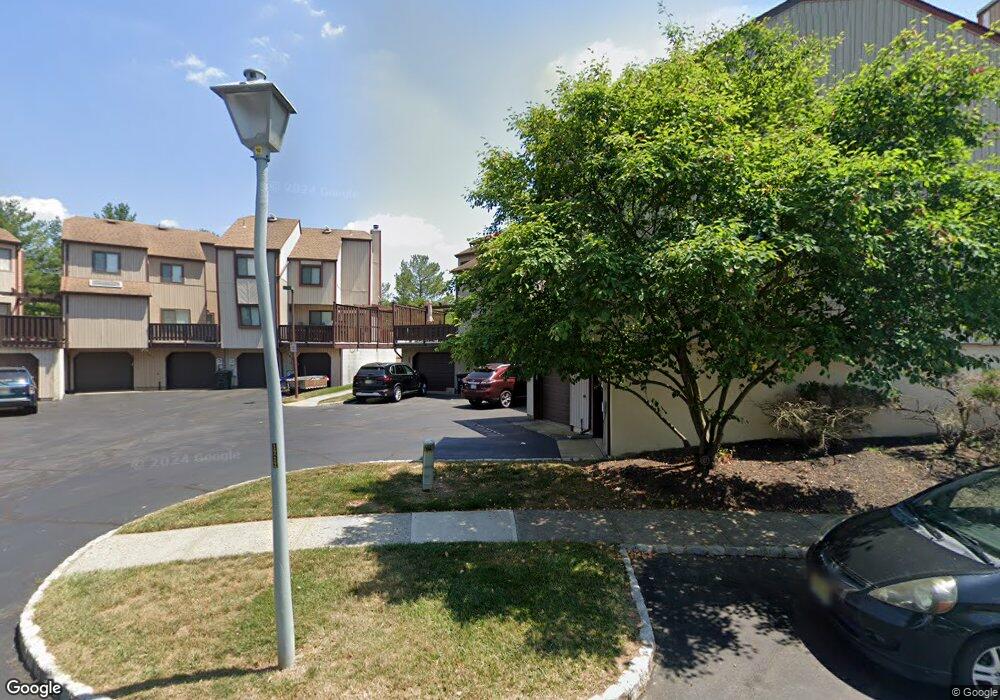
263 Silver Ln Old Bridge, NJ 08857
Estimated Value: $501,000 - $530,454
2
Beds
3
Baths
1,293
Sq Ft
$401/Sq Ft
Est. Value
About This Home
This home is located at 263 Silver Ln, Old Bridge, NJ 08857 and is currently estimated at $518,864, approximately $401 per square foot. 263 Silver Ln is a home located in Middlesex County with nearby schools including Old Bridge High School, St. Thomas the Apostle School, and St. Ambrose School.
Ownership History
Date
Name
Owned For
Owner Type
Purchase Details
Closed on
Aug 26, 2020
Sold by
Seung Kit and Seung May
Bought by
Khamchuk Olha and Satanovskyi Oleksandr
Current Estimated Value
Home Financials for this Owner
Home Financials are based on the most recent Mortgage that was taken out on this home.
Original Mortgage
$240,000
Outstanding Balance
$212,984
Interest Rate
2.9%
Mortgage Type
New Conventional
Estimated Equity
$305,880
Purchase Details
Closed on
Jul 31, 2001
Sold by
Almeida Joao
Bought by
Seung Kit and May Seung
Home Financials for this Owner
Home Financials are based on the most recent Mortgage that was taken out on this home.
Original Mortgage
$100,000
Interest Rate
6.99%
Purchase Details
Closed on
Nov 20, 1998
Sold by
Collins Earl
Bought by
Almeida Joao and Almeida Luis
Home Financials for this Owner
Home Financials are based on the most recent Mortgage that was taken out on this home.
Original Mortgage
$147,250
Interest Rate
6.68%
Create a Home Valuation Report for This Property
The Home Valuation Report is an in-depth analysis detailing your home's value as well as a comparison with similar homes in the area
Home Values in the Area
Average Home Value in this Area
Purchase History
| Date | Buyer | Sale Price | Title Company |
|---|---|---|---|
| Khamchuk Olha | $300,000 | All Ahead Title Agency Llc | |
| Khamchuk Olha | $300,000 | All Ahead Title | |
| Seung Kit | $190,900 | -- | |
| Almeida Joao | $155,000 | -- |
Source: Public Records
Mortgage History
| Date | Status | Borrower | Loan Amount |
|---|---|---|---|
| Open | Khamchuk Olha | $240,000 | |
| Closed | Khamchuk Olha | $240,000 | |
| Previous Owner | Seung Kit | $100,000 | |
| Previous Owner | Almeida Joao | $147,250 |
Source: Public Records
Tax History
| Year | Tax Paid | Tax Assessment Tax Assessment Total Assessment is a certain percentage of the fair market value that is determined by local assessors to be the total taxable value of land and additions on the property. | Land | Improvement |
|---|---|---|---|---|
| 2025 | $7,127 | $126,200 | $37,900 | $88,300 |
| 2024 | $6,836 | $126,200 | $37,900 | $88,300 |
| 2023 | $6,836 | $126,200 | $37,900 | $88,300 |
| 2022 | $6,680 | $126,200 | $37,900 | $88,300 |
| 2021 | $4,903 | $126,200 | $37,900 | $88,300 |
| 2020 | $6,483 | $126,200 | $37,900 | $88,300 |
| 2019 | $6,373 | $126,200 | $37,900 | $88,300 |
| 2018 | $6,302 | $126,200 | $37,900 | $88,300 |
| 2017 | $6,098 | $126,200 | $37,900 | $88,300 |
| 2016 | $5,972 | $126,200 | $37,900 | $88,300 |
| 2015 | $5,868 | $126,200 | $37,900 | $88,300 |
| 2014 | $5,809 | $126,200 | $37,900 | $88,300 |
Source: Public Records
Map
Nearby Homes
- 17 Willow Dr
- 120 Diamond Ln
- 42 Mariposa Place
- 60 Amber Dr
- 51 Malibu Ct
- 815 Marlboro Rd
- 55 Valley Vale Dr
- 3 Falcon Ct
- 1732 New Jersey 18
- 97 Osprey Dr
- 11 Lincroft Ave
- 28 Walden Ct
- 10101 Falston Cir Unit 101
- 10101 Falston Cir
- 8323 Falston Cir
- 2211 Falston Cir Unit 211
- 2211 Falston Cir
- 2327 Falston Cir
- 18 Grace Dr
- 37 Walden Ct
Your Personal Tour Guide
Ask me questions while you tour the home.