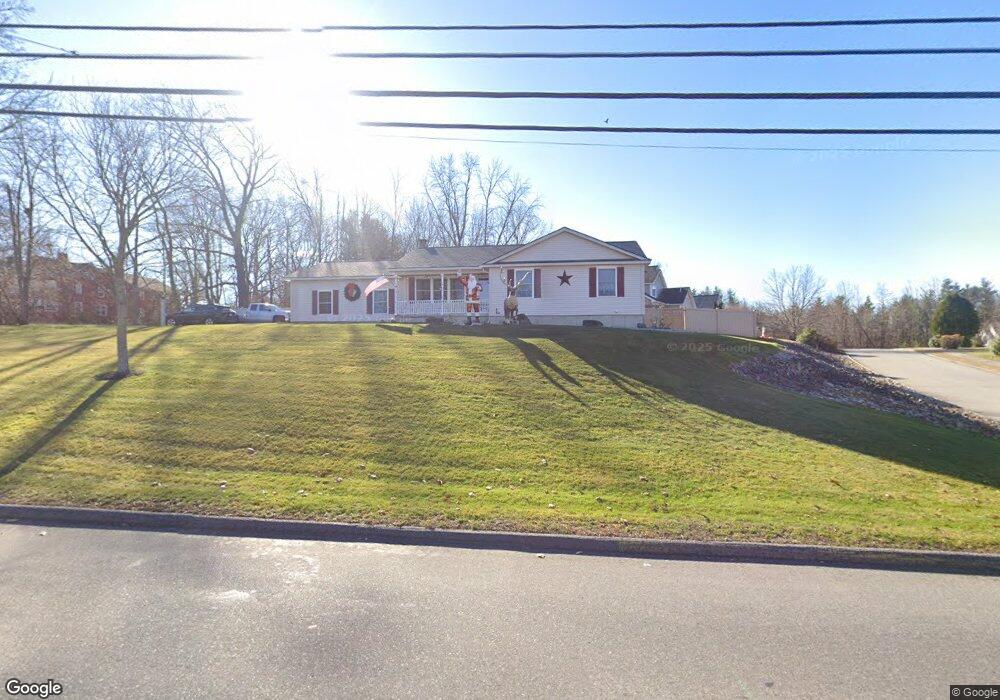
263 South St Biddeford, ME 04005
Estimated Value: $523,000 - $548,000
2
Beds
2
Baths
1,370
Sq Ft
$392/Sq Ft
Est. Value
About This Home
This home is located at 263 South St, Biddeford, ME 04005 and is currently estimated at $536,412, approximately $391 per square foot. 263 South St is a home located in York County with nearby schools including John F Kennedy Memorial School, Biddeford Intermediate School, and Biddeford Primary School.
Ownership History
Date
Name
Owned For
Owner Type
Purchase Details
Closed on
Feb 22, 2012
Sold by
Pelletier Deborah F and Pelletier Peter A
Bought by
Ronco Michelle and Ronco Thomas
Current Estimated Value
Home Financials for this Owner
Home Financials are based on the most recent Mortgage that was taken out on this home.
Original Mortgage
$215,000
Outstanding Balance
$145,145
Interest Rate
3.89%
Mortgage Type
New Conventional
Estimated Equity
$391,267
Create a Home Valuation Report for This Property
The Home Valuation Report is an in-depth analysis detailing your home's value as well as a comparison with similar homes in the area
Home Values in the Area
Average Home Value in this Area
Purchase History
| Date | Buyer | Sale Price | Title Company |
|---|---|---|---|
| Ronco Michelle | -- | -- | |
| Ronco Michelle | -- | -- |
Source: Public Records
Mortgage History
| Date | Status | Borrower | Loan Amount |
|---|---|---|---|
| Open | Ronco Michelle | $215,000 | |
| Closed | Ronco Michelle | $215,000 | |
| Previous Owner | Ronco Michelle | $247,450 |
Source: Public Records
Tax History
| Year | Tax Paid | Tax Assessment Tax Assessment Total Assessment is a certain percentage of the fair market value that is determined by local assessors to be the total taxable value of land and additions on the property. | Land | Improvement |
|---|---|---|---|---|
| 2025 | $6,273 | $419,900 | $185,100 | $234,800 |
| 2024 | $5,948 | $418,300 | $185,100 | $233,200 |
| 2023 | $5,450 | $415,400 | $182,200 | $233,200 |
| 2022 | $5,348 | $325,900 | $104,500 | $221,400 |
| 2021 | $4,532 | $279,600 | $90,100 | $189,500 |
| 2020 | $4,297 | $253,800 | $79,300 | $174,500 |
| 2019 | $3,859 | $253,800 | $79,300 | $174,500 |
| 2018 | $3,682 | $253,800 | $79,300 | $174,500 |
| 2017 | $3,541 | $231,300 | $79,300 | $152,000 |
| 2016 | $3,398 | $231,300 | $79,300 | $152,000 |
| 2015 | $4,192 | $231,300 | $79,300 | $152,000 |
| 2014 | $4,089 | $231,300 | $79,300 | $152,000 |
| 2013 | -- | $258,700 | $82,900 | $175,800 |
Source: Public Records
Map
Nearby Homes
- 9 Brook St
- 7 Brook St
- 37 Westmore Ave
- 88 May St Unit 101
- 88 May St Unit 102
- 18 Plymouth Dr
- 19 Lessard Ave
- 5 Apostolic Way
- 11 Chadwick Place
- 5 Horrigan Ct
- 66 W Cutts St
- 391 Main St
- 374-376 Alfred St
- 312 Alfred St
- 317 Alfred St Unit 101
- 66 Graham St
- 4 Kossuth St
- 433 Elm St
- 49 Harding St
- 242 Lincoln St
Your Personal Tour Guide
Ask me questions while you tour the home.