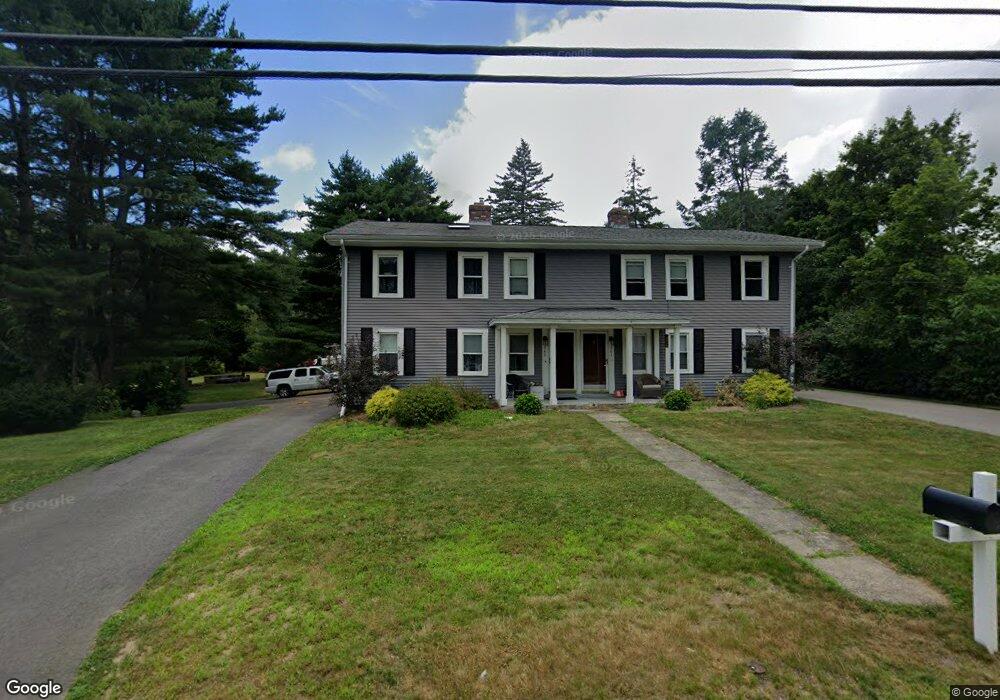
263 South St Foxboro, MA 02035
Estimated Value: $822,512 - $873,000
6
Beds
4
Baths
3,162
Sq Ft
$266/Sq Ft
Est. Value
About This Home
This home is located at 263 South St, Foxboro, MA 02035 and is currently estimated at $840,878, approximately $265 per square foot. 263 South St is a home located in Norfolk County with nearby schools including Foxborough High School, Foxborough Regional Charter School, and Hands-On-Montessori School.
Ownership History
Date
Name
Owned For
Owner Type
Purchase Details
Closed on
Sep 22, 2014
Sold by
Spier Gregory P and Crane-Spier Kathryn
Bought by
261-263 South Street R
Current Estimated Value
Purchase Details
Closed on
Nov 22, 2002
Sold by
Fitzhenry David B and Fitzhenry Jill M
Bought by
Spier Gregory P and Spier Kathyrn
Home Financials for this Owner
Home Financials are based on the most recent Mortgage that was taken out on this home.
Original Mortgage
$246,100
Interest Rate
6.07%
Mortgage Type
Purchase Money Mortgage
Purchase Details
Closed on
Jun 25, 1998
Sold by
Fitzhenry John J and Fitzhenry Maureen F
Bought by
Kruglewicz Stephen
Home Financials for this Owner
Home Financials are based on the most recent Mortgage that was taken out on this home.
Original Mortgage
$337,500
Interest Rate
7.09%
Mortgage Type
Purchase Money Mortgage
Create a Home Valuation Report for This Property
The Home Valuation Report is an in-depth analysis detailing your home's value as well as a comparison with similar homes in the area
Home Values in the Area
Average Home Value in this Area
Purchase History
| Date | Buyer | Sale Price | Title Company |
|---|---|---|---|
| 261-263 South Street R | -- | -- | |
| Spier Gregory P | $246,100 | -- | |
| Kruglewicz Stephen | $375,000 | -- |
Source: Public Records
Mortgage History
| Date | Status | Borrower | Loan Amount |
|---|---|---|---|
| Previous Owner | Spier Gregory P | $246,100 | |
| Previous Owner | Kruglewicz Stephen | $337,500 |
Source: Public Records
Tax History Compared to Growth
Tax History
| Year | Tax Paid | Tax Assessment Tax Assessment Total Assessment is a certain percentage of the fair market value that is determined by local assessors to be the total taxable value of land and additions on the property. | Land | Improvement |
|---|---|---|---|---|
| 2025 | $9,368 | $708,600 | $237,200 | $471,400 |
| 2024 | $8,097 | $599,300 | $255,400 | $343,900 |
| 2023 | $7,767 | $546,600 | $243,400 | $303,200 |
| 2022 | $7,350 | $506,200 | $218,500 | $287,700 |
| 2021 | $7,416 | $503,100 | $207,600 | $295,500 |
| 2020 | $7,330 | $503,100 | $207,600 | $295,500 |
| 2019 | $7,169 | $487,700 | $208,100 | $279,600 |
| 2018 | $6,073 | $416,800 | $197,800 | $219,000 |
| 2017 | $6,233 | $414,400 | $194,500 | $219,900 |
| 2016 | $5,961 | $402,200 | $187,400 | $214,800 |
| 2015 | $5,157 | $339,500 | $139,900 | $199,600 |
| 2014 | $5,089 | $339,500 | $139,900 | $199,600 |
Source: Public Records
Map
Nearby Homes
- 80 Mill St
- 406 South St
- 356 Central St
- 12 Spring St
- 14 Baker St
- 11 Orchard Place Unit 11
- 11 W Belcher Rd Unit 2
- 24 Mechanic St
- 450 West St
- 84 Cocasset St Unit A6
- 277 Central St
- 18 Winter St Unit E
- 14 Winter St Unit B
- 483 Thurston St
- 166 Chauncy St
- 16 Treasure Island Rd
- 11 Goodwin Dr
- 14 Foxhill Rd
- 28 Angell St
- 44 Angell St Unit 44