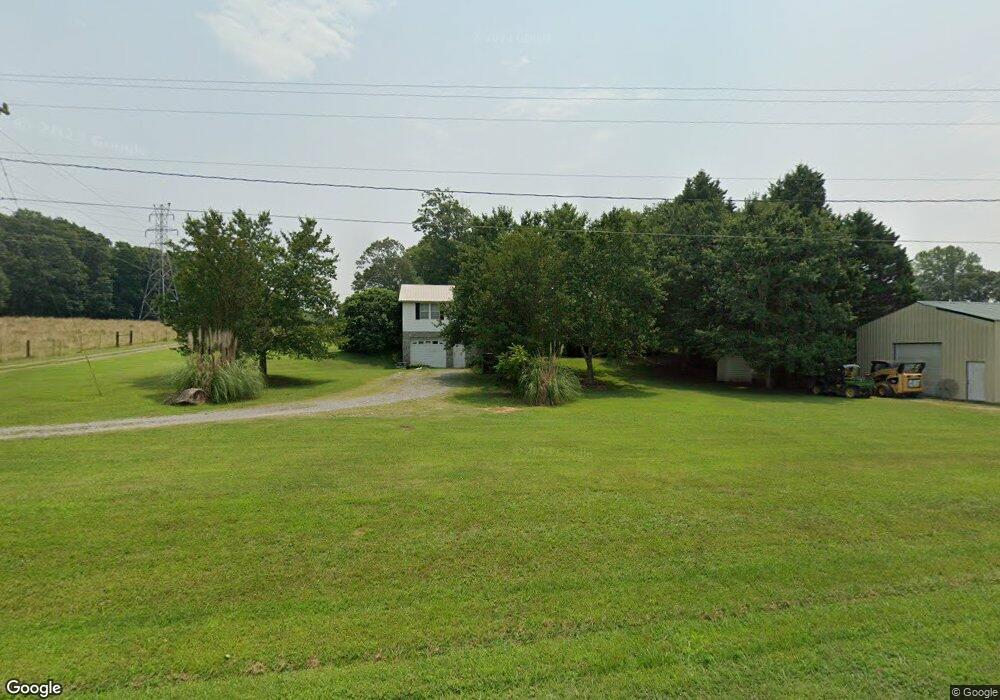
263 Stowe Rd Gastonia, NC 28056
Estimated Value: $372,000 - $470,000
3
Beds
2
Baths
1,455
Sq Ft
$289/Sq Ft
Est. Value
About This Home
This home is located at 263 Stowe Rd, Gastonia, NC 28056 and is currently estimated at $420,560, approximately $289 per square foot. 263 Stowe Rd is a home located in Gaston County with nearby schools including New Hope Elementary School, Cramerton Middle School, and South Point High School.
Ownership History
Date
Name
Owned For
Owner Type
Purchase Details
Closed on
Jan 22, 2015
Sold by
Fannie Mae
Bought by
Mills Holly N and Mills James P
Current Estimated Value
Purchase Details
Closed on
Jul 1, 2014
Sold by
Stowe Robert and Stowe Nancy J
Bought by
Federal National Mortgage Association and Fannie Mae
Purchase Details
Closed on
Jun 26, 2003
Sold by
Clark Alex L and Clark Renee S
Bought by
Stowe Robert
Home Financials for this Owner
Home Financials are based on the most recent Mortgage that was taken out on this home.
Original Mortgage
$126,350
Interest Rate
8.75%
Mortgage Type
Purchase Money Mortgage
Purchase Details
Closed on
Jun 10, 1998
Sold by
Clark Renee S and Clark Alex L
Bought by
Clark Alex L and Clark Renee S
Home Financials for this Owner
Home Financials are based on the most recent Mortgage that was taken out on this home.
Original Mortgage
$80,000
Interest Rate
7.23%
Create a Home Valuation Report for This Property
The Home Valuation Report is an in-depth analysis detailing your home's value as well as a comparison with similar homes in the area
Home Values in the Area
Average Home Value in this Area
Purchase History
| Date | Buyer | Sale Price | Title Company |
|---|---|---|---|
| Mills Holly N | -- | None Available | |
| Federal National Mortgage Association | $126,825 | None Available | |
| Stowe Robert | $133,000 | -- | |
| Clark Alex L | -- | -- |
Source: Public Records
Mortgage History
| Date | Status | Borrower | Loan Amount |
|---|---|---|---|
| Previous Owner | Stowe Robert | $126,350 | |
| Previous Owner | Clark Alex L | $80,000 |
Source: Public Records
Tax History Compared to Growth
Tax History
| Year | Tax Paid | Tax Assessment Tax Assessment Total Assessment is a certain percentage of the fair market value that is determined by local assessors to be the total taxable value of land and additions on the property. | Land | Improvement |
|---|---|---|---|---|
| 2025 | $2,283 | $319,770 | $27,500 | $292,270 |
| 2024 | $2,283 | $319,770 | $27,500 | $292,270 |
| 2023 | $2,222 | $319,770 | $27,500 | $292,270 |
| 2022 | $1,638 | $178,050 | $20,000 | $158,050 |
| 2021 | $1,651 | $178,050 | $20,000 | $158,050 |
| 2019 | $1,645 | $178,050 | $20,000 | $158,050 |
| 2018 | $1,488 | $153,377 | $20,160 | $133,217 |
| 2017 | $1,469 | $153,377 | $20,160 | $133,217 |
| 2016 | $1,469 | $153,377 | $0 | $0 |
| 2014 | $1,443 | $151,867 | $24,600 | $127,267 |
Source: Public Records
Map
Nearby Homes
- 210 Harrison Ln
- 4539 S New Hope Rd
- 339 Deep Forest Ct
- 4616 Mcchesney Dr
- 5313 Old Town Ln
- 104 Crest St
- 5060 Cramer Woods Dr
- 2215 Hodgin St
- 1404 Caracara Ct
- 7030 Dolphin St
- 425 Huffstetler Rd
- 1610 Swallow Tail Dr
- 1616 Swallow Tail Dr
- 1708 Heron Ct
- Sweetbay II Plan at Redhawk - Walk
- Inlet Plan at Redhawk - Enclave
- 1641 Swallow Tail Dr
- 1700 Heron Ct
- Hunter Plan at Redhawk - Enclave
- 1639 Swallow Tail Dr