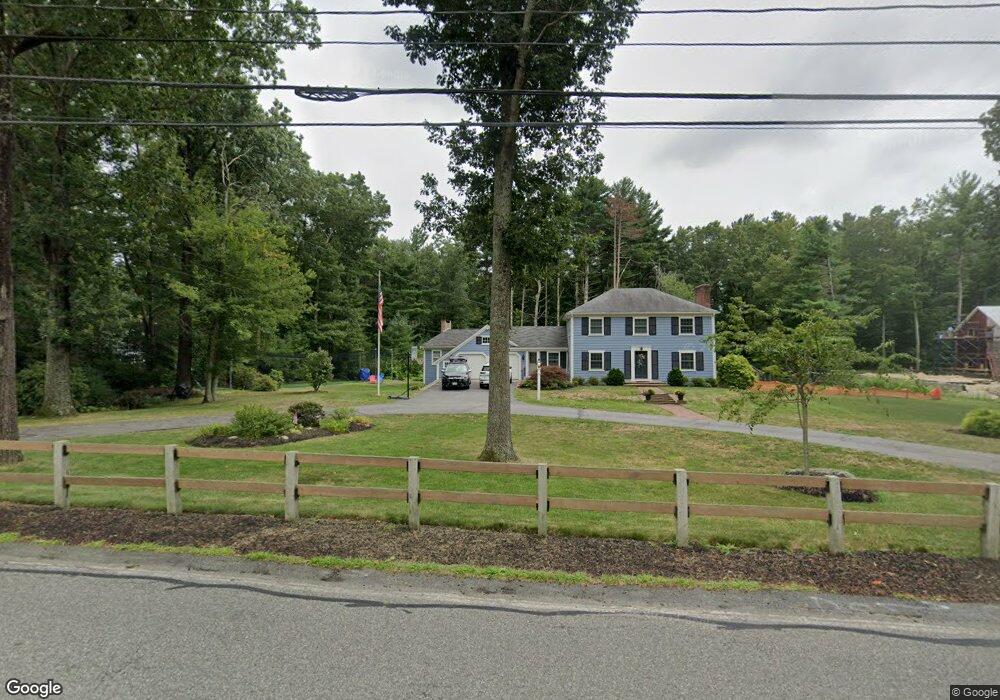
263 Union St Hanover, MA 02339
Estimated Value: $815,000 - $965,000
4
Beds
3
Baths
2,192
Sq Ft
$404/Sq Ft
Est. Value
About This Home
This home is located at 263 Union St, Hanover, MA 02339 and is currently estimated at $884,544, approximately $403 per square foot. 263 Union St is a home located in Plymouth County with nearby schools including Hanover High School, Cadence Academy Preschool - Hanover, and The Master's Academy.
Ownership History
Date
Name
Owned For
Owner Type
Purchase Details
Closed on
Oct 26, 2022
Sold by
Phillips Cheryl E and Adami Frederick W
Bought by
Barrett Joel D and Barrett Kerstin A
Current Estimated Value
Purchase Details
Closed on
Feb 29, 2016
Sold by
Phillips Cheryl E and Adami Frederick W
Bought by
Barrett Joel D
Home Financials for this Owner
Home Financials are based on the most recent Mortgage that was taken out on this home.
Original Mortgage
$350,000
Interest Rate
3.92%
Mortgage Type
New Conventional
Purchase Details
Closed on
Dec 8, 2015
Sold by
Barbara D Adami T 2 and Rockland T Co Tr
Bought by
Phillips Cheryl E and Adami Frederick W
Purchase Details
Closed on
Mar 10, 2015
Sold by
Adami Barbara D Est
Bought by
Rockland Tco
Purchase Details
Closed on
Aug 1, 2007
Sold by
Marsden Rt and Martin
Bought by
261 Union Street Rt and Holland
Home Financials for this Owner
Home Financials are based on the most recent Mortgage that was taken out on this home.
Original Mortgage
$0
Interest Rate
6.69%
Mortgage Type
Commercial
Create a Home Valuation Report for This Property
The Home Valuation Report is an in-depth analysis detailing your home's value as well as a comparison with similar homes in the area
Home Values in the Area
Average Home Value in this Area
Purchase History
| Date | Buyer | Sale Price | Title Company |
|---|---|---|---|
| Barrett Joel D | -- | None Available | |
| Barrett Joel D | -- | None Available | |
| Barrett Joel D | $500,000 | -- | |
| Phillips Cheryl E | -- | -- | |
| Rockland Tco | -- | -- | |
| Rockland Tco | -- | -- | |
| 261 Union Street Rt | $3,450,000 | -- | |
| Phillips Cheryl E | -- | -- | |
| Rockland Tco | -- | -- | |
| 261 Union Street Rt | $3,450,000 | -- |
Source: Public Records
Mortgage History
| Date | Status | Borrower | Loan Amount |
|---|---|---|---|
| Previous Owner | Barrett Joel D | $350,000 | |
| Previous Owner | 261 Union Street Rt | $0 |
Source: Public Records
Tax History
| Year | Tax Paid | Tax Assessment Tax Assessment Total Assessment is a certain percentage of the fair market value that is determined by local assessors to be the total taxable value of land and additions on the property. | Land | Improvement |
|---|---|---|---|---|
| 2025 | $9,367 | $758,500 | $287,400 | $471,100 |
| 2024 | $9,154 | $712,900 | $287,400 | $425,500 |
| 2023 | $8,928 | $661,800 | $256,900 | $404,900 |
| 2022 | $9,371 | $614,500 | $256,900 | $357,600 |
| 2021 | $9,107 | $565,100 | $233,800 | $331,300 |
| 2020 | $8,979 | $550,500 | $233,800 | $316,700 |
| 2019 | $9,265 | $530,000 | $233,800 | $296,200 |
| 2018 | $5,102 | $500,800 | $233,800 | $267,000 |
| 2017 | $7,687 | $465,300 | $217,500 | $247,800 |
| 2016 | $7,420 | $440,100 | $197,900 | $242,200 |
| 2015 | $7,108 | $440,100 | $197,900 | $242,200 |
Source: Public Records
Map
Nearby Homes
- 62 Larchmont Ln
- 506 Main St
- 53 Chestnut St
- 776 Main St
- 68 East St
- 44 Stone Meadow Ln
- 47 Stone Meadow Ln
- 33 1st Parish Ln
- 36 Grove St
- 535 Webster St
- 250 Center St
- 51 Cervelli Farm Dr
- 37 Dr
- 23 Cervelli Farm Dr
- 38 Cervelli Farm Dr
- 9 Cervelli Farm Dr
- 46 Brookwood Rd
- 73 Shingle Mill Ln
- 36 Bayberry Ln
- 164 Main St
- Lot 9 Broadway-Left of 1395
- Lot 7 Broadway-Right of 1395
- lot 1 Trailside Ln
- Lot 69 Center Street - Right of 720
- lot six Elijahs Path
- lot one Elijahs Path
- lot five Elijahs Path
- lot three Elijahs Path
- Lot 1 Bard Rock Ln
- Lot 2 Bard Rock Ln
- 268 Union St
- 291 Union St
- 275 Union St
- 290 Union St
- 248 Union St
- 239 Union St
- 301 Union St
- 49 Cobblestone Ln
- 24 Deborah Rd
- 236 Union St
Your Personal Tour Guide
Ask me questions while you tour the home.