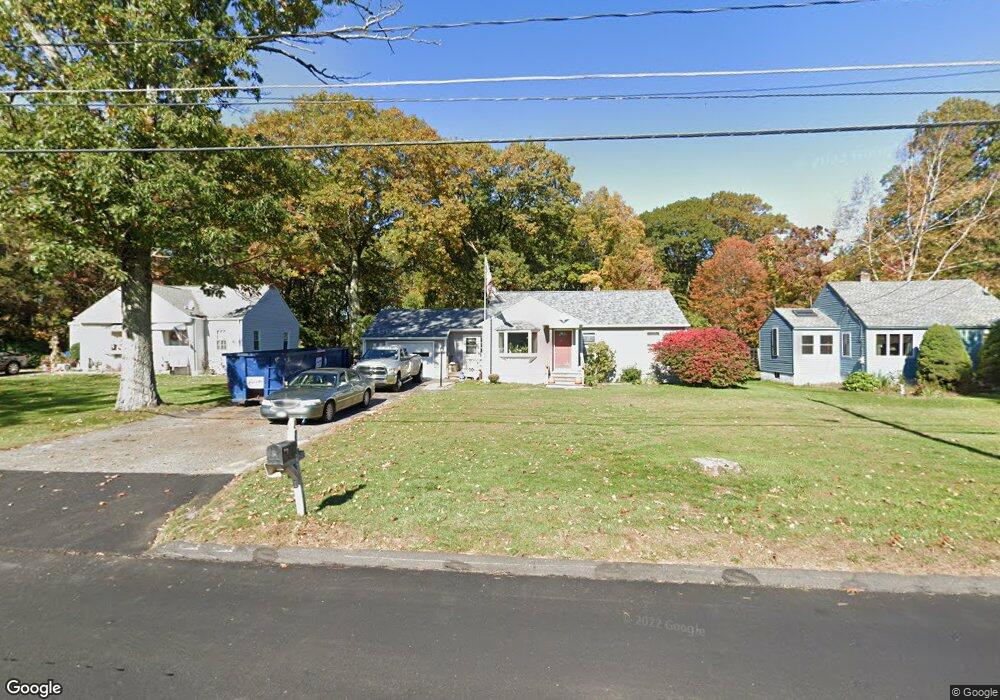
263 W Pearl Rd Torrington, CT 06790
Estimated Value: $344,551 - $394,000
3
Beds
2
Baths
1,528
Sq Ft
$241/Sq Ft
Est. Value
About This Home
This home is located at 263 W Pearl Rd, Torrington, CT 06790 and is currently estimated at $367,888, approximately $240 per square foot. 263 W Pearl Rd is a home located in Litchfield County with nearby schools including Torrington Middle School, Torrington High School, and Torrington Christian Academy.
Ownership History
Date
Name
Owned For
Owner Type
Purchase Details
Closed on
Jan 25, 2021
Sold by
Vincent Glen J
Bought by
Gomez David M
Current Estimated Value
Home Financials for this Owner
Home Financials are based on the most recent Mortgage that was taken out on this home.
Original Mortgage
$138,105
Outstanding Balance
$123,541
Interest Rate
2.71%
Mortgage Type
Future Advance Clause Open End Mortgage
Estimated Equity
$244,347
Purchase Details
Closed on
Sep 20, 2001
Sold by
Blakeslee Vernon A and Blakeslee Rose M
Bought by
Vincent Glen J and Vincent Raymond J
Home Financials for this Owner
Home Financials are based on the most recent Mortgage that was taken out on this home.
Original Mortgage
$157,500
Interest Rate
6.98%
Mortgage Type
Purchase Money Mortgage
Create a Home Valuation Report for This Property
The Home Valuation Report is an in-depth analysis detailing your home's value as well as a comparison with similar homes in the area
Home Values in the Area
Average Home Value in this Area
Purchase History
| Date | Buyer | Sale Price | Title Company |
|---|---|---|---|
| Gomez David M | $35,000 | None Available | |
| Vincent Glen J | $160,000 | -- |
Source: Public Records
Mortgage History
| Date | Status | Borrower | Loan Amount |
|---|---|---|---|
| Open | Gomez David M | $138,105 | |
| Previous Owner | Vincent Glen J | $164,800 | |
| Previous Owner | Vincent Glen J | $157,500 | |
| Previous Owner | Vincent Glen J | $50,000 |
Source: Public Records
Tax History Compared to Growth
Tax History
| Year | Tax Paid | Tax Assessment Tax Assessment Total Assessment is a certain percentage of the fair market value that is determined by local assessors to be the total taxable value of land and additions on the property. | Land | Improvement |
|---|---|---|---|---|
| 2025 | $8,406 | $218,610 | $32,760 | $185,850 |
| 2024 | $5,999 | $125,050 | $32,760 | $92,290 |
| 2023 | $5,997 | $125,050 | $32,760 | $92,290 |
| 2022 | $5,895 | $125,050 | $32,760 | $92,290 |
| 2021 | $5,130 | $111,120 | $32,760 | $78,360 |
| 2020 | $5,130 | $111,120 | $32,760 | $78,360 |
| 2019 | $4,770 | $103,320 | $36,400 | $66,920 |
| 2018 | $4,770 | $103,320 | $36,400 | $66,920 |
| 2017 | $4,727 | $103,320 | $36,400 | $66,920 |
| 2016 | $4,727 | $103,320 | $36,400 | $66,920 |
| 2015 | $4,727 | $103,320 | $36,400 | $66,920 |
| 2014 | $5,188 | $142,840 | $61,500 | $81,340 |
Source: Public Records
Map
Nearby Homes
- 1683 Torringford St
- 70 Suncrest Ct
- 251 Windtree St
- 96 Berkshire Oval Unit 96
- 158 Cypress Ct Unit 158
- 57 Dibble St
- 138 Harrison Rd
- 54 Greenridge Rd
- 66 Harrison Rd
- 1229 Winsted Rd Unit 91
- 1275 Winsted Rd Unit 101
- 1275 Winsted Rd Unit 534
- 1275 Winsted Rd Unit 533
- 179 Greenridge Rd
- 00 Kennedy Dr
- 37 Louis Cir
- 714 Torringford St
- 302 Gillette Rd
- 2376 Torringford St
- 60 Wildwood Rd
- 253 W Pearl Rd
- 271 W Pearl Rd
- 219 W Pearl Rd
- 281 W Pearl Rd
- 291 W Pearl Rd
- 156 Country Club Rd
- 144 Country Club Rd
- 301 W Pearl Rd
- 16 Silver Fox Ln
- 130 Country Club Rd
- 182 Country Club Rd
- 11 Silver Fox Ln
- 244 W Pearl Rd
- 116 Country Club Rd
- 196 Country Club Rd
- 218 W W Pearl Rd
- 218 W Pearl Rd
- 300 W Pearl Rd
- 104 Country Club Rd
- 210 Country Club Rd