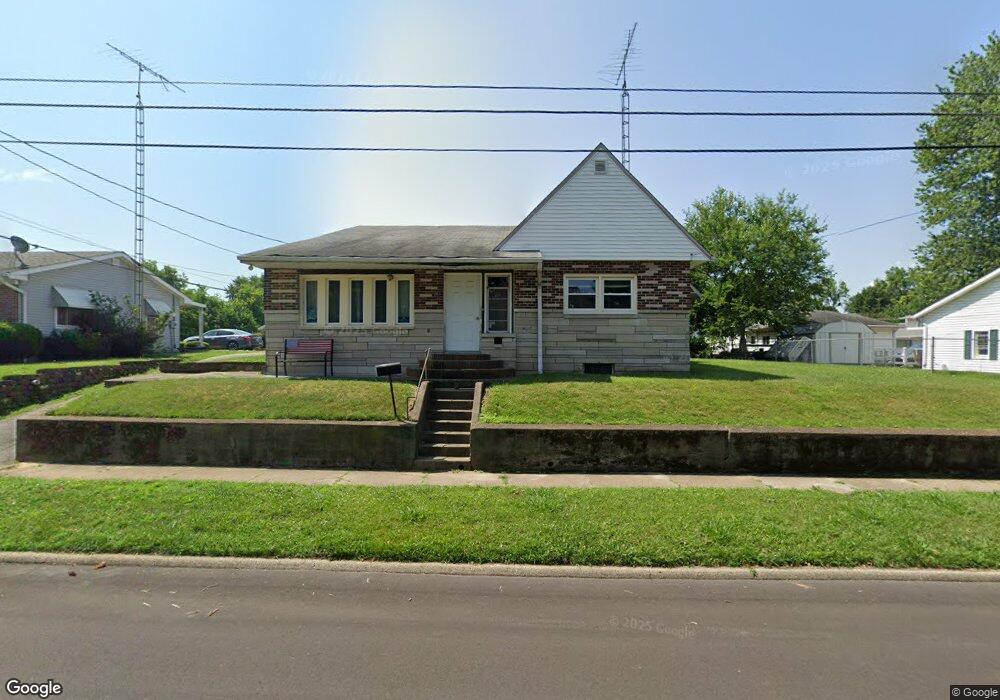
263 W Spring St Bloomfield, IN 47424
Estimated Value: $88,000 - $168,000
3
Beds
1
Bath
1,480
Sq Ft
$96/Sq Ft
Est. Value
About This Home
This home is located at 263 W Spring St, Bloomfield, IN 47424 and is currently estimated at $141,997, approximately $95 per square foot. 263 W Spring St is a home located in Greene County with nearby schools including Bloomfield Elementary School and Bloomfield Junior/Senior High School.
Ownership History
Date
Name
Owned For
Owner Type
Purchase Details
Closed on
Sep 8, 2011
Sold by
Lemons Richard A and Lemons Debra S
Bought by
Kirby Steven W
Current Estimated Value
Home Financials for this Owner
Home Financials are based on the most recent Mortgage that was taken out on this home.
Original Mortgage
$58,000
Interest Rate
4.32%
Mortgage Type
New Conventional
Create a Home Valuation Report for This Property
The Home Valuation Report is an in-depth analysis detailing your home's value as well as a comparison with similar homes in the area
Purchase History
| Date | Buyer | Sale Price | Title Company |
|---|---|---|---|
| Kirby Steven W | -- | None Available |
Source: Public Records
Mortgage History
| Date | Status | Borrower | Loan Amount |
|---|---|---|---|
| Closed | Kirby Steven W | $58,000 |
Source: Public Records
Tax History
| Year | Tax Paid | Tax Assessment Tax Assessment Total Assessment is a certain percentage of the fair market value that is determined by local assessors to be the total taxable value of land and additions on the property. | Land | Improvement |
|---|---|---|---|---|
| 2025 | $679 | $113,900 | $7,000 | $106,900 |
| 2024 | $679 | $88,800 | $7,000 | $81,800 |
| 2023 | $642 | $88,000 | $7,000 | $81,000 |
| 2022 | $742 | $90,600 | $7,000 | $83,600 |
| 2021 | $682 | $83,000 | $7,000 | $76,000 |
| 2020 | $489 | $72,100 | $7,000 | $65,100 |
| 2019 | $480 | $72,100 | $7,000 | $65,100 |
| 2018 | $508 | $75,100 | $7,000 | $68,100 |
| 2017 | $478 | $73,900 | $7,000 | $66,900 |
| 2016 | $477 | $72,200 | $7,000 | $65,200 |
| 2014 | $428 | $72,500 | $7,000 | $65,500 |
| 2013 | -- | $69,700 | $7,000 | $62,700 |
Source: Public Records
Map
Nearby Homes
- 318, 332 W Spring St
- 430 W Spring St
- 455 W Main St
- 530 W Spring St
- 1 Indiana 54
- 523 W South St
- 422 W Turner St
- 0 Cleveland St
- Lot 4 E Cedar Ridge Ln
- 207 River Dr
- 209 River Dr
- 240 N Cleveland St
- 633 S Washington St
- 6 E Judson St
- 1997 N Cold Springs Rd
- 600 Forest Dr
- 551 N Washington St
- 1208 S 1st St
- 1201 Indiana 157
- 1346 N Old Worthington Rd
- 247 W Spring St
- 121 S Lewis St
- 264 W Mechanic St
- 279 W Spring St
- 102 S Lewis St
- 246 W Mechanic St
- 278 W Mechanic St
- 235 W Spring St
- 318 & 332 W Spring St
- 242 W Mechanic St
- 230 W Mechanic St
- 148 S Lewis St
- 223 W Spring St
- 228 W Spring St
- 230 W Spring St
- 146 S Seminary St
- 224 W Spring St
- 327 W Spring St
- 263 W Mechanic St
- 124 S Seminary St
Your Personal Tour Guide
Ask me questions while you tour the home.