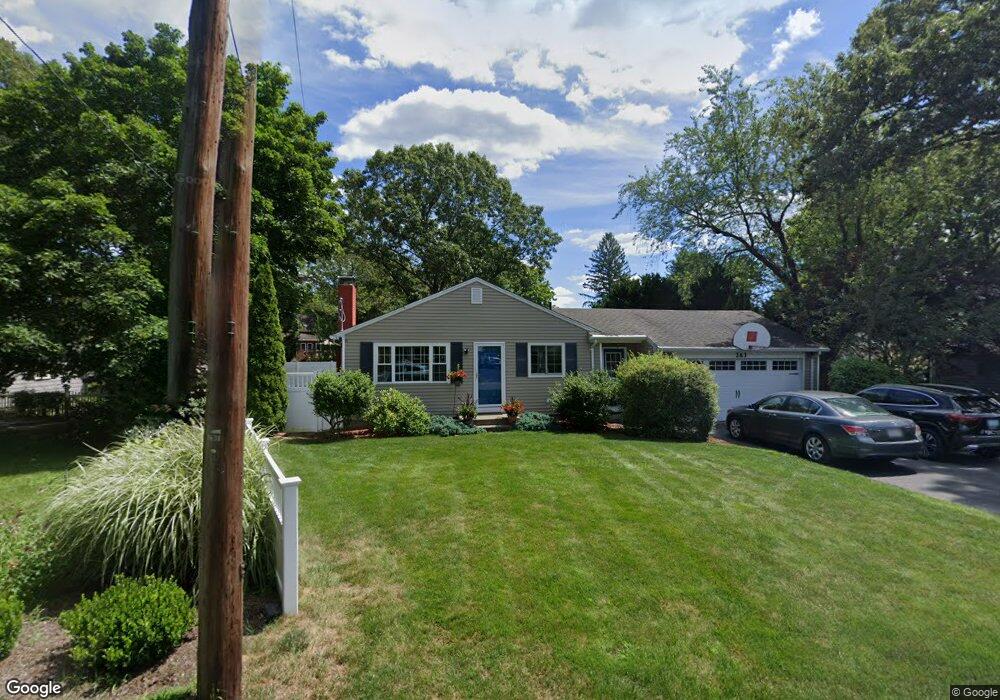
263 West Ave Seekonk, MA 02771
Estimated Value: $460,000 - $541,000
3
Beds
2
Baths
891
Sq Ft
$556/Sq Ft
Est. Value
About This Home
This home is located at 263 West Ave, Seekonk, MA 02771 and is currently estimated at $495,376, approximately $555 per square foot. 263 West Ave is a home located in Bristol County with nearby schools including Seekonk High School, St Margaret School, and The Wolf School.
Ownership History
Date
Name
Owned For
Owner Type
Purchase Details
Closed on
Sep 17, 2002
Sold by
West Avenue Nt and Yeargin
Bought by
Hardro Peter J and Hardro Shelley J
Current Estimated Value
Home Financials for this Owner
Home Financials are based on the most recent Mortgage that was taken out on this home.
Original Mortgage
$210,000
Interest Rate
6.48%
Mortgage Type
Purchase Money Mortgage
Purchase Details
Closed on
Feb 15, 2002
Sold by
Bank Of New York
Bought by
West Avenue Nt and Yeargin
Home Financials for this Owner
Home Financials are based on the most recent Mortgage that was taken out on this home.
Original Mortgage
$140,680
Interest Rate
7.14%
Mortgage Type
Purchase Money Mortgage
Purchase Details
Closed on
Nov 21, 2001
Sold by
Phillips Cheryl A and Bank Of New York
Bought by
Bank Of New York
Purchase Details
Closed on
Aug 3, 1995
Sold by
Rickey Frederick J and Rickey Irene L
Bought by
Philips Scott R
Create a Home Valuation Report for This Property
The Home Valuation Report is an in-depth analysis detailing your home's value as well as a comparison with similar homes in the area
Home Values in the Area
Average Home Value in this Area
Purchase History
| Date | Buyer | Sale Price | Title Company |
|---|---|---|---|
| Hardro Peter J | $240,000 | -- | |
| West Avenue Nt | $147,100 | -- | |
| Bank Of New York | $120,000 | -- | |
| Philips Scott R | $125,000 | -- |
Source: Public Records
Mortgage History
| Date | Status | Borrower | Loan Amount |
|---|---|---|---|
| Open | Philips Scott R | $140,000 | |
| Closed | Philips Scott R | $210,000 | |
| Previous Owner | Philips Scott R | $140,680 | |
| Previous Owner | Philips Scott R | $94,250 |
Source: Public Records
Tax History
| Year | Tax Paid | Tax Assessment Tax Assessment Total Assessment is a certain percentage of the fair market value that is determined by local assessors to be the total taxable value of land and additions on the property. | Land | Improvement |
|---|---|---|---|---|
| 2025 | $4,850 | $392,700 | $143,100 | $249,600 |
| 2024 | $4,672 | $378,300 | $143,100 | $235,200 |
| 2023 | $4,531 | $345,600 | $127,900 | $217,700 |
| 2022 | $4,111 | $308,200 | $122,600 | $185,600 |
| 2021 | $3,953 | $291,300 | $108,700 | $182,600 |
| 2020 | $3,632 | $275,800 | $108,600 | $167,200 |
| 2019 | $3,525 | $269,900 | $108,600 | $161,300 |
| 2018 | $3,496 | $261,900 | $108,600 | $153,300 |
| 2017 | $3,417 | $253,900 | $103,900 | $150,000 |
| 2016 | $3,382 | $252,200 | $103,900 | $148,300 |
| 2015 | $3,112 | $235,200 | $90,900 | $144,300 |
Source: Public Records
Map
Nearby Homes
- 14 Field St
- 0 Arcade Ave Unit 73446971
- 250 Ferris Ave
- 23 Morra Way
- 11 Bellevue Blvd
- 40 Weeden Ave
- 40 E Point Dr Unit 6
- 38 E Point Dr Unit 5
- 36 E Point Dr Unit 4
- 34 E Point Dr Unit 3
- 71 Bent Rd
- 91 Seabiscuit Place
- 106 Coyle Ave
- 0 Newman Ave Rear
- 245 Manton St
- 38 Lowell Ave
- 242 Manton #41 St
- 57 Whirlaway Place
- 242 Manton St
- 377 Read St
Your Personal Tour Guide
Ask me questions while you tour the home.