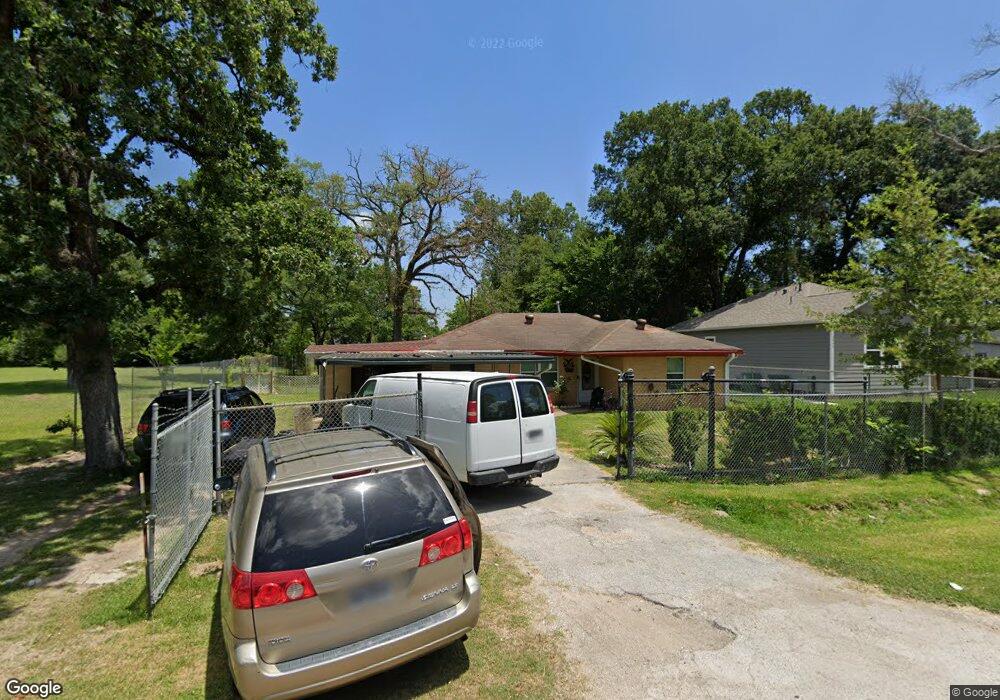
2630 Homer St Houston, TX 77091
Acres Homes NeighborhoodEstimated Value: $203,246 - $243,000
3
Beds
1
Bath
1,251
Sq Ft
$176/Sq Ft
Est. Value
About This Home
This home is located at 2630 Homer St, Houston, TX 77091 and is currently estimated at $219,812, approximately $175 per square foot. 2630 Homer St is a home located in Harris County with nearby schools including Edward a Vines EC/Pre-K/K School, Harris Elementary School, and Hoffman Middle School.
Ownership History
Date
Name
Owned For
Owner Type
Purchase Details
Closed on
Jan 29, 2015
Sold by
2630 Homer Trust
Bought by
Zeron Olvin and Perez Elia Hernandez
Current Estimated Value
Home Financials for this Owner
Home Financials are based on the most recent Mortgage that was taken out on this home.
Original Mortgage
$39,900
Interest Rate
3.89%
Mortgage Type
Purchase Money Mortgage
Purchase Details
Closed on
Dec 31, 2014
Sold by
Hreal Co Llc
Bought by
2630 Homer Trust
Home Financials for this Owner
Home Financials are based on the most recent Mortgage that was taken out on this home.
Original Mortgage
$39,900
Interest Rate
3.89%
Mortgage Type
Purchase Money Mortgage
Purchase Details
Closed on
Dec 23, 2014
Sold by
Jenkins Wynell Dewitt
Bought by
Hreal Company Llc
Home Financials for this Owner
Home Financials are based on the most recent Mortgage that was taken out on this home.
Original Mortgage
$39,900
Interest Rate
3.89%
Mortgage Type
Purchase Money Mortgage
Purchase Details
Closed on
Nov 18, 2014
Sold by
Jenkins Wynell Delano
Bought by
Jenkins Wynell
Create a Home Valuation Report for This Property
The Home Valuation Report is an in-depth analysis detailing your home's value as well as a comparison with similar homes in the area
Home Values in the Area
Average Home Value in this Area
Purchase History
| Date | Buyer | Sale Price | Title Company |
|---|---|---|---|
| Zeron Olvin | -- | None Available | |
| 2630 Homer Trust | -- | None Available | |
| Hreal Company Llc | -- | None Available | |
| Jenkins Wynell | -- | None Available |
Source: Public Records
Mortgage History
| Date | Status | Borrower | Loan Amount |
|---|---|---|---|
| Closed | Zeron Olvin | $39,900 |
Source: Public Records
Tax History Compared to Growth
Tax History
| Year | Tax Paid | Tax Assessment Tax Assessment Total Assessment is a certain percentage of the fair market value that is determined by local assessors to be the total taxable value of land and additions on the property. | Land | Improvement |
|---|---|---|---|---|
| 2025 | $4,680 | $213,199 | $116,875 | $96,324 |
| 2024 | $4,680 | $206,228 | $116,875 | $89,353 |
| 2023 | $4,680 | $199,680 | $108,375 | $91,305 |
| 2022 | $3,181 | $132,627 | $68,400 | $64,227 |
| 2021 | $1,887 | $75,124 | $29,100 | $46,024 |
| 2020 | $1,840 | $69,708 | $27,900 | $41,808 |
| 2019 | $1,929 | $69,708 | $27,900 | $41,808 |
| 2018 | $865 | $60,243 | $24,000 | $36,243 |
| 2017 | $1,598 | $60,243 | $24,000 | $36,243 |
| 2016 | $1,598 | $60,243 | $24,000 | $36,243 |
| 2015 | $1,025 | $38,531 | $15,001 | $23,530 |
| 2014 | $1,025 | $38,531 | $15,001 | $23,530 |
Source: Public Records
Map
Nearby Homes
- 2507 Garapan St
- 2511 Garapan St
- 2478 Druid St
- 6210 Rolland St
- 2515 Garapan St
- 2732 De Soto St
- 2519 Garapan St
- 2100 De Soto St
- 6216 Carver Rd
- 2626 Druid St
- 1 De Soto St
- 1933 De Soto St
- 2422 Dalview St
- 2639 Dalview St
- 2919 Garapan St
- 2441 Garapan St
- 2643 Dalview St
- 2420 Dalview St
- 6217 Nuben St
- 5612 Azores
- 2626 Homer St
- 6231 Easter St
- 6231 Rolland St
- 6227 Easter St
- 2459 Garapan St
- 6235 Easter St
- 6235 Rolland St
- 2465 Garapan St
- 0 Homer Dr
- 2631 Homer St
- 2627 Homer St
- 2469 Garapan St
- 2453 Garapan St
- 2623 Homer St
- 2473 Garapan St
- 2437 Garapan St
- 2702 De Soto St
- 2449 Garapan St
- 2619 Homer St
- 2445 Garapan St