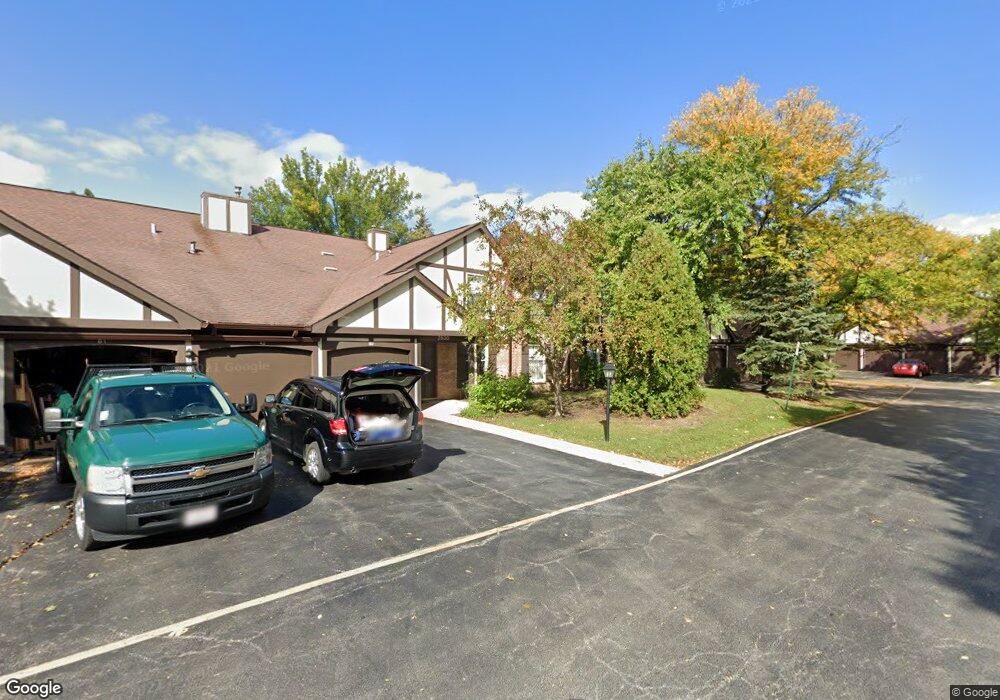
2630 Northampton Dr Unit 11B1 Rolling Meadows, IL 60008
Busse Woods NeighborhoodEstimated Value: $234,719 - $284,000
2
Beds
--
Bath
1,200
Sq Ft
$221/Sq Ft
Est. Value
About This Home
This home is located at 2630 Northampton Dr Unit 11B1, Rolling Meadows, IL 60008 and is currently estimated at $265,180, approximately $220 per square foot. 2630 Northampton Dr Unit 11B1 is a home located in Cook County with nearby schools including Willow Bend Elementary School, Gale School, and King Elementary School.
Ownership History
Date
Name
Owned For
Owner Type
Purchase Details
Closed on
May 15, 2006
Sold by
Mick Justin M
Bought by
Sanchez Jorge L and Garcia Laura M
Current Estimated Value
Home Financials for this Owner
Home Financials are based on the most recent Mortgage that was taken out on this home.
Original Mortgage
$152,800
Outstanding Balance
$89,303
Interest Rate
6.56%
Mortgage Type
Fannie Mae Freddie Mac
Estimated Equity
$175,877
Purchase Details
Closed on
Dec 26, 2000
Sold by
Loger Krista
Bought by
Loger Krista and Loger Carl
Purchase Details
Closed on
Nov 2, 1996
Sold by
Rickert Josef
Bought by
Loger Krista
Create a Home Valuation Report for This Property
The Home Valuation Report is an in-depth analysis detailing your home's value as well as a comparison with similar homes in the area
Home Values in the Area
Average Home Value in this Area
Purchase History
| Date | Buyer | Sale Price | Title Company |
|---|---|---|---|
| Sanchez Jorge L | $191,000 | Attorneys Title Guaranty Fun | |
| Loger Krista | -- | -- | |
| Loger Krista | -- | -- |
Source: Public Records
Mortgage History
| Date | Status | Borrower | Loan Amount |
|---|---|---|---|
| Open | Sanchez Jorge L | $152,800 |
Source: Public Records
Tax History Compared to Growth
Tax History
| Year | Tax Paid | Tax Assessment Tax Assessment Total Assessment is a certain percentage of the fair market value that is determined by local assessors to be the total taxable value of land and additions on the property. | Land | Improvement |
|---|---|---|---|---|
| 2024 | $4,201 | $17,073 | $3,082 | $13,991 |
| 2023 | $3,989 | $17,073 | $3,082 | $13,991 |
| 2022 | $3,989 | $17,073 | $3,082 | $13,991 |
| 2021 | $2,365 | $10,509 | $2,022 | $8,487 |
| 2020 | $2,382 | $10,509 | $2,022 | $8,487 |
| 2019 | $2,416 | $11,780 | $2,022 | $9,758 |
| 2018 | $2,686 | $11,768 | $1,733 | $10,035 |
| 2017 | $2,651 | $11,768 | $1,733 | $10,035 |
| 2016 | $2,727 | $11,768 | $1,733 | $10,035 |
| 2015 | $3,250 | $12,999 | $1,541 | $11,458 |
| 2014 | $3,190 | $12,999 | $1,541 | $11,458 |
| 2013 | $3,095 | $12,999 | $1,541 | $11,458 |
Source: Public Records
Map
Nearby Homes
- 2930 Northampton Dr Unit A2
- 2508 Algonquin Rd Unit 16
- 2504 Algonquin Rd Unit 14
- 2504 Algonquin Rd Unit 17
- 2312 Algonquin Rd Unit 3
- 2402 Algonquin Rd Unit 9
- 2503 Fulle St Unit 17
- 5200 Carriageway Dr Unit 101
- 2303 Fulle St
- 1117 S Old Wilke Rd Unit 206
- 1217 S Old Wilke Rd Unit 11110
- 1217 S Old Wilke Rd Unit 11406
- 1207 S Old Wilke Rd Unit 303
- 1107 S Old Wilke Rd Unit 201
- 1227 S Old Wilke Rd Unit 201
- 1227 S Old Wilke Rd Unit 306
- 1126 S New Wilke Rd Unit 307
- 1206 S New Wilke Rd Unit 108
- 3805 Wren Ln
- 5500 Carriageway Dr Unit 213
- 2630 Northampton Dr Unit 11B2
- 2630 Northampton Dr Unit 11C1
- 2630 Northampton Dr Unit 11D2
- 2630 Northampton Dr Unit 11C2
- 2630 Northampton Dr Unit 11D1
- 2630 Northampton Dr Unit 11A1
- 2630 Northampton Dr Unit 11A2
- 2630 Northampton Dr Unit C-1
- 2630 Northampton Dr Unit C2
- 2630 Northampton Dr Unit A1
- 2630 Northampton Dr Unit A2
- 2710 Northampton Dr Unit 26A2
- 2710 Northampton Dr Unit 26D1
- 2710 Northampton Dr Unit 26D2
- 2710 Northampton Dr Unit 26C1
- 2710 Northampton Dr Unit 26C2
- 2710 Northampton Dr Unit 26B2
- 2710 Northampton Dr Unit 26B1
- 2710 Northampton Dr Unit A1
- 2710 Northampton Dr Unit 2710 Northampton Uni