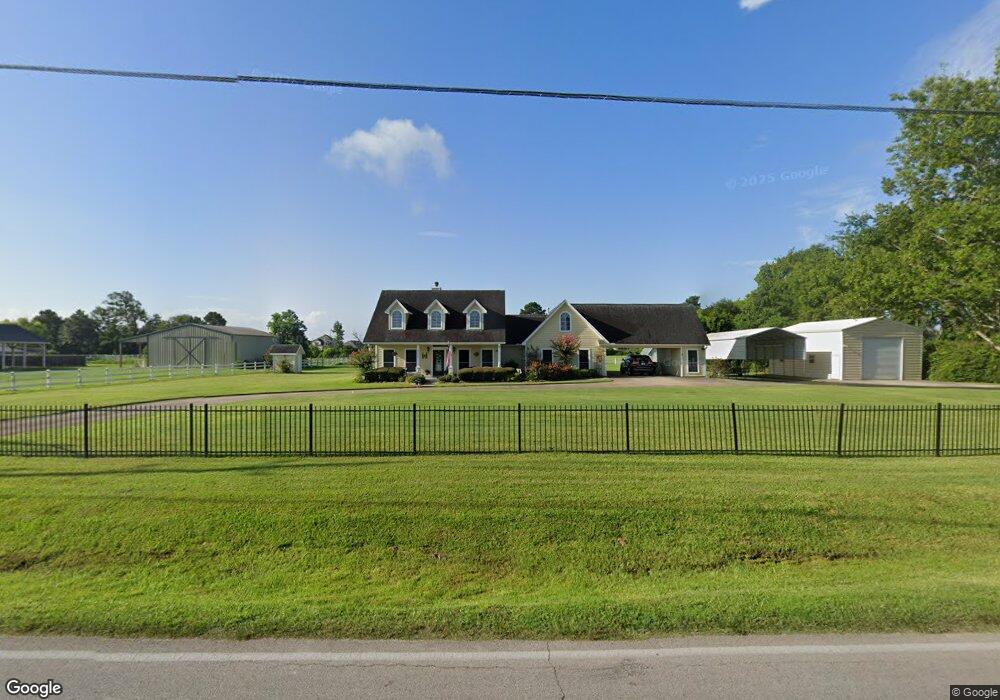
26310 Decker Prairie Rosehl Rd Magnolia, TX 77355
Estimated Value: $394,000 - $492,000
3
Beds
2
Baths
2,340
Sq Ft
$191/Sq Ft
Est. Value
About This Home
This home is located at 26310 Decker Prairie Rosehl Rd, Magnolia, TX 77355 and is currently estimated at $447,651, approximately $191 per square foot. 26310 Decker Prairie Rosehl Rd is a home located in Montgomery County with nearby schools including Decker Prairie Elementary School, Tomball Intermediate School, and Tomball Junior High School.
Ownership History
Date
Name
Owned For
Owner Type
Purchase Details
Closed on
Aug 28, 2006
Sold by
Hardee Texstar Homes Inc
Bought by
Herron John Lee and Herron Cheryl Anne
Current Estimated Value
Home Financials for this Owner
Home Financials are based on the most recent Mortgage that was taken out on this home.
Original Mortgage
$179,000
Outstanding Balance
$108,197
Interest Rate
6.79%
Mortgage Type
Purchase Money Mortgage
Estimated Equity
$339,454
Purchase Details
Closed on
Jan 18, 2005
Sold by
Bohne Lelon Maurine and Hardee Billie Mae
Bought by
Hardee Texstar Homes Inc
Home Financials for this Owner
Home Financials are based on the most recent Mortgage that was taken out on this home.
Original Mortgage
$191,600
Interest Rate
5.8%
Mortgage Type
Construction
Create a Home Valuation Report for This Property
The Home Valuation Report is an in-depth analysis detailing your home's value as well as a comparison with similar homes in the area
Home Values in the Area
Average Home Value in this Area
Purchase History
| Date | Buyer | Sale Price | Title Company |
|---|---|---|---|
| Herron John Lee | -- | Chicago Title | |
| Hardee Texstar Homes Inc | -- | -- |
Source: Public Records
Mortgage History
| Date | Status | Borrower | Loan Amount |
|---|---|---|---|
| Open | Herron John Lee | $179,000 | |
| Previous Owner | Hardee Texstar Homes Inc | $191,600 |
Source: Public Records
Tax History Compared to Growth
Tax History
| Year | Tax Paid | Tax Assessment Tax Assessment Total Assessment is a certain percentage of the fair market value that is determined by local assessors to be the total taxable value of land and additions on the property. | Land | Improvement |
|---|---|---|---|---|
| 2025 | $1,007 | $360,193 | -- | -- |
| 2024 | $971 | $327,448 | -- | -- |
| 2023 | $971 | $297,680 | $161,160 | $219,700 |
| 2022 | $4,999 | $270,620 | $134,300 | $219,700 |
| 2021 | $4,727 | $246,020 | $89,540 | $166,850 |
| 2020 | $4,482 | $223,650 | $89,540 | $166,850 |
| 2019 | $4,014 | $203,320 | $89,540 | $134,700 |
| 2018 | $2,561 | $184,840 | $50,140 | $134,700 |
| 2017 | $3,906 | $187,710 | $50,140 | $137,570 |
| 2016 | $3,641 | $174,970 | $50,140 | $137,570 |
| 2015 | $2,287 | $159,060 | $21,490 | $137,570 |
| 2014 | $2,287 | $159,060 | $21,490 | $137,570 |
Source: Public Records
Map
Nearby Homes
- 25717 Merino Ct
- 26443 Red Clover Dr
- 26407 Red Clover Dr
- 27303 Decker Prairie-Rosehill Rd
- 25404 Decker Prairie-Rosehill Rd
- 26354 Cedar Sedge Dr
- 26255 Arrowleaf Dr
- 26234 Arrowleaf Dr
- 26275 Arrowleaf Dr
- 26279 Arrowleaf Dr
- 26283 Arrowleaf Dr
- 26287 Arrowleaf Dr
- 26291 Arrowleaf Dr
- 26295 Arrowleaf Dr
- 26266 Arrowleaf Dr
- 26299 Arrowleaf Dr
- 26270 Arrowleaf Dr
- 26303 Arrowleaf Dr
- 26274 Arrowleaf Dr
- 26278 Arrowleaf Dr
- 26318 Decker Prairie Rosehl Rd
- 000 Decker Prairie
- 26875 Ausmas Ln
- 25828 Rugosa Dr
- 25817 Rugosa Dr
- 26326 Decker Prairie-Rosehill Rd
- 25844 Ausmas Ln
- 26326 Decker Prairie Rosehl Rd
- 26119 Decker Prairie
- 26859 Ausmas Ln
- 26816 Ausmas Ln
- 25737 Damask Dr
- 26808 Ausmas Ln
- 26832 Ausmas Ln
- 26307 Decker Prairie Rosehl Rd
- 26307 Decker Prairie Rosehl Rd
- 26828 Ausmas Ln
- 26804 Ausmas Ln
- 26836 Ausmas Ln
- 26863 Ausmas Ln