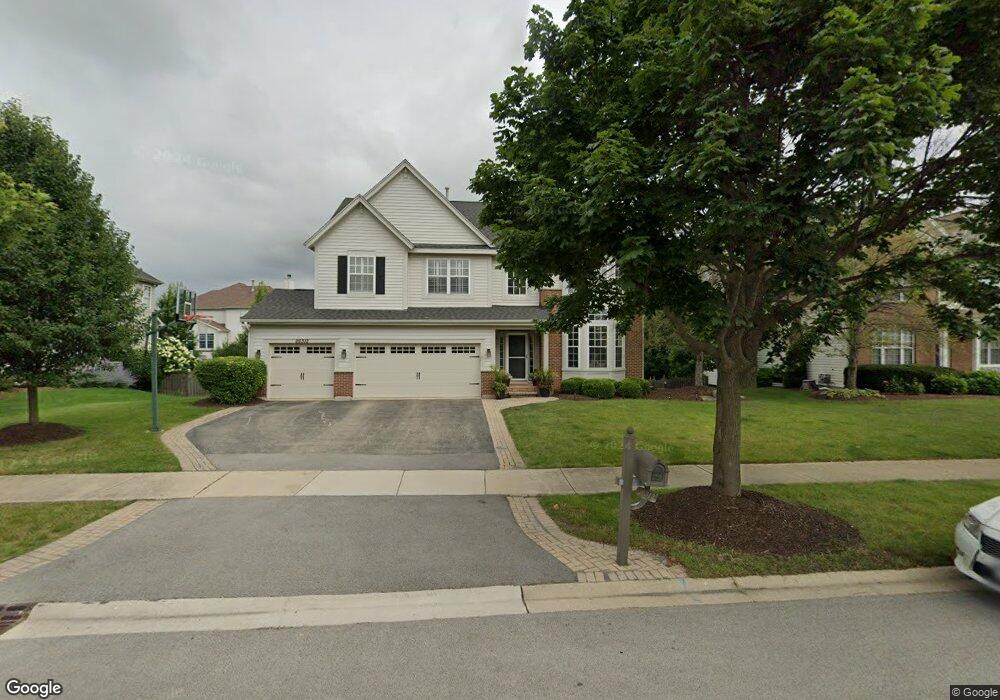
26312 Mapleview Dr Plainfield, IL 60585
North Plainfield NeighborhoodEstimated Value: $577,000 - $673,000
4
Beds
3
Baths
3,402
Sq Ft
$181/Sq Ft
Est. Value
About This Home
This home is located at 26312 Mapleview Dr, Plainfield, IL 60585 and is currently estimated at $617,048, approximately $181 per square foot. 26312 Mapleview Dr is a home located in Will County with nearby schools including Lincoln Elementary School, Heritage Grove Middle School, and Plainfield North High School.
Ownership History
Date
Name
Owned For
Owner Type
Purchase Details
Closed on
Aug 5, 2004
Sold by
Roycroft Llc
Bought by
Hacker Keith B and Hacker Andrea L
Current Estimated Value
Home Financials for this Owner
Home Financials are based on the most recent Mortgage that was taken out on this home.
Original Mortgage
$314,421
Outstanding Balance
$171,159
Interest Rate
7.5%
Mortgage Type
New Conventional
Estimated Equity
$445,889
Purchase Details
Closed on
Jan 7, 2004
Sold by
Mpi 1 Development Llc
Bought by
Roycroft Llc
Create a Home Valuation Report for This Property
The Home Valuation Report is an in-depth analysis detailing your home's value as well as a comparison with similar homes in the area
Home Values in the Area
Average Home Value in this Area
Purchase History
| Date | Buyer | Sale Price | Title Company |
|---|---|---|---|
| Hacker Keith B | $393,500 | Chicago Title Insurance Co | |
| Roycroft Llc | $735,000 | Chicago Title Insurance Co |
Source: Public Records
Mortgage History
| Date | Status | Borrower | Loan Amount |
|---|---|---|---|
| Open | Hacker Keith B | $314,421 | |
| Closed | Roycroft Llc | $0 | |
| Closed | Roycroft Llc | $73,500 | |
| Closed | Hacker Keith B | $78,605 |
Source: Public Records
Tax History
| Year | Tax Paid | Tax Assessment Tax Assessment Total Assessment is a certain percentage of the fair market value that is determined by local assessors to be the total taxable value of land and additions on the property. | Land | Improvement |
|---|---|---|---|---|
| 2024 | $13,303 | $186,908 | $37,461 | $149,447 |
| 2023 | $13,303 | $165,113 | $33,093 | $132,020 |
| 2022 | $12,472 | $149,491 | $31,304 | $118,187 |
| 2021 | $11,342 | $142,372 | $29,813 | $112,559 |
| 2020 | $11,297 | $140,117 | $29,341 | $110,776 |
| 2019 | $11,135 | $136,168 | $28,514 | $107,654 |
| 2018 | $11,474 | $137,192 | $27,887 | $109,305 |
| 2017 | $11,429 | $133,650 | $27,167 | $106,483 |
| 2016 | $11,468 | $130,773 | $26,582 | $104,191 |
| 2015 | $10,724 | $125,744 | $25,560 | $100,184 |
| 2014 | $10,724 | $118,715 | $25,130 | $93,585 |
| 2013 | $10,724 | $118,715 | $25,130 | $93,585 |
Source: Public Records
Map
Nearby Homes
- 26228 W Sablewood Cir
- 26232 W Sablewood Cir
- 26216 W Sablewood Cir
- 26212 W Sablewood Cir
- 26244 W Sablewood Cir
- 26241 W Sablewood Cir
- 26257 W Sablewood Cir
- 26261 W Sablewood Cir
- 26341 W Sablewood Cir
- 26209 W Sablewood Cir
- 26313 W Sablewood Cir
- 26105 Grande Park Blvd
- 26101 Grande Park Blvd
- 26321 W Sablewood Cir
- 26305 W Sablewood Cir
- 26414 Rustling Birch Way
- 26325 W Sablewood Cir
- 26115 Mapleview Dr
- 26312 W Sablewood Cir
- 26308 W Sablewood Cir
- 26302 Mapleview Dr
- 26316 Mapleview Dr
- 26233 Whispering Woods Cir
- 26237 Whispering Woods Cir
- 26229 Whispering Woods Cir
- 26234 Mapleview Dr
- 26326 Mapleview Dr
- 26305 Mapleview Dr
- 26311 Mapleview Dr
- 26214 Whispering Woods Cir
- 26301 Mapleview Dr
- 26317 Mapleview Dr
- 26340 Mapleview Dr
- 26228 Mapleview Dr
- 26350 Mapleview Dr
- 26233 Mapleview Dr
- 26245 Whispering Woods Cir
- 26323 Mapleview Dr
- 26228 Whispering Woods Cir
- 26232 Whispering Woods Cir
Your Personal Tour Guide
Ask me questions while you tour the home.