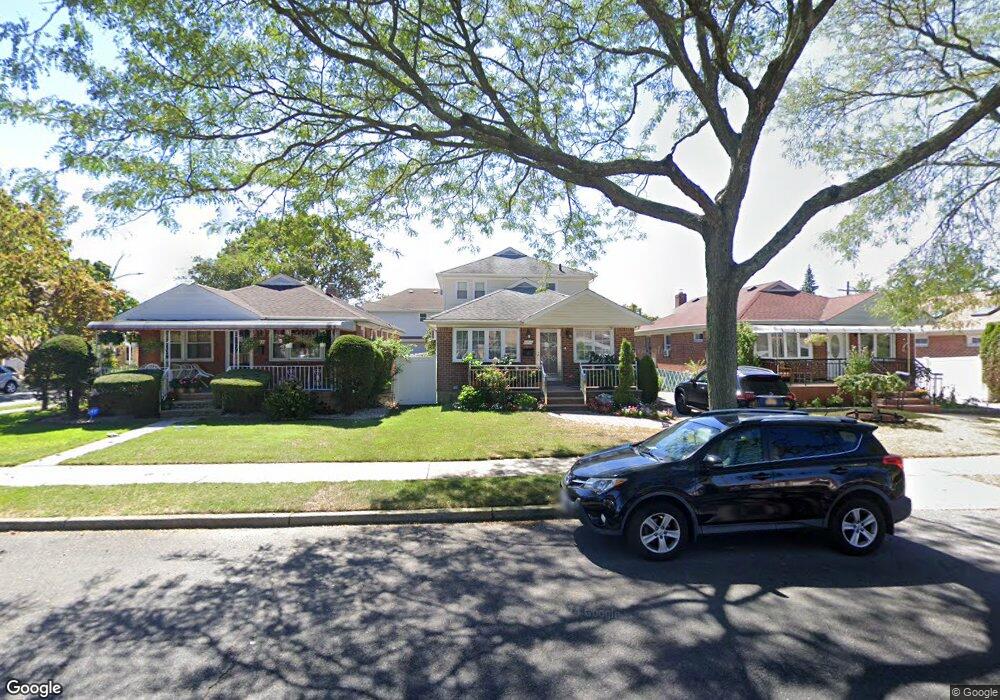
26316 79th Ave Glen Oaks, NY 11004
Estimated Value: $938,000 - $1,273,000
6
Beds
3
Baths
1,848
Sq Ft
$568/Sq Ft
Est. Value
About This Home
This home is located at 26316 79th Ave, Glen Oaks, NY 11004 and is currently estimated at $1,049,495, approximately $567 per square foot. 26316 79th Ave is a home located in Queens County with nearby schools including P.S.115Q James J Ambrose School, Fremont/Hay Elementary School, and Irwin Altman Middle School 172.
Ownership History
Date
Name
Owned For
Owner Type
Purchase Details
Closed on
Sep 18, 2018
Sold by
Babu Benson G and Babu George P
Bought by
Babu George P and Babu Lovely Sara
Current Estimated Value
Purchase Details
Closed on
Apr 21, 2015
Sold by
Consenza Trustee Theresa
Bought by
Babu Benson G and Babu Lovely Sara
Home Financials for this Owner
Home Financials are based on the most recent Mortgage that was taken out on this home.
Original Mortgage
$458,000
Interest Rate
3.76%
Mortgage Type
New Conventional
Purchase Details
Closed on
Mar 27, 1996
Sold by
Ciccotto Theresa
Bought by
Theresa Ciccotto Revocable Trust
Create a Home Valuation Report for This Property
The Home Valuation Report is an in-depth analysis detailing your home's value as well as a comparison with similar homes in the area
Home Values in the Area
Average Home Value in this Area
Purchase History
| Date | Buyer | Sale Price | Title Company |
|---|---|---|---|
| Babu George P | -- | -- | |
| Babu George P | -- | -- | |
| Babu Benson G | $572,500 | -- | |
| Babu Benson G | $572,500 | -- | |
| Babu Benson G | $572,500 | -- | |
| Theresa Ciccotto Revocable Trust | -- | -- | |
| Theresa Ciccotto Revocable Trust | -- | -- |
Source: Public Records
Mortgage History
| Date | Status | Borrower | Loan Amount |
|---|---|---|---|
| Previous Owner | Babu Benson G | $458,000 |
Source: Public Records
Tax History Compared to Growth
Tax History
| Year | Tax Paid | Tax Assessment Tax Assessment Total Assessment is a certain percentage of the fair market value that is determined by local assessors to be the total taxable value of land and additions on the property. | Land | Improvement |
|---|---|---|---|---|
| 2025 | $9,962 | $49,974 | $15,514 | $34,460 |
| 2024 | $7,556 | $49,597 | $15,936 | $33,661 |
| 2023 | $9,398 | $46,790 | $14,354 | $32,436 |
| 2022 | $6,609 | $50,820 | $18,720 | $32,100 |
| 2021 | $8,764 | $47,820 | $18,720 | $29,100 |
| 2020 | $8,815 | $50,340 | $18,720 | $31,620 |
| 2019 | $8,646 | $51,780 | $18,720 | $33,060 |
| 2018 | $7,949 | $38,992 | $15,458 | $23,534 |
| 2017 | $7,499 | $36,786 | $17,337 | $19,449 |
| 2016 | $6,938 | $36,786 | $17,337 | $19,449 |
| 2015 | $3,405 | $34,704 | $20,480 | $14,224 |
| 2014 | $3,405 | $34,443 | $20,121 | $14,322 |
Source: Public Records
Map
Nearby Homes
- 78-07 264th St
- 79-12 268th St
- 78-37 267th St
- 80-18 261st St
- 80-64 266th St
- 81-25 265th St
- 80-59 268th St
- 260-18 75th Ave Unit 1st fl
- 80-37 259th St
- 78-30 270th St
- 8143 262nd St
- 7653 268th St
- 81-56 264th St
- 7836 271st St
- 78-36 271st St
- 8133 260th St
- 260-73 75th Ave Unit 1st Fl
- 8168 Langdale St Unit 263A
- 80-27 257th St
- 81-49 268th St Unit 290B