26317 Clarita Redford, MI 48240
Estimated Value: $177,000 - $226,000
4
Beds
2
Baths
1,000
Sq Ft
$194/Sq Ft
Est. Value
About This Home
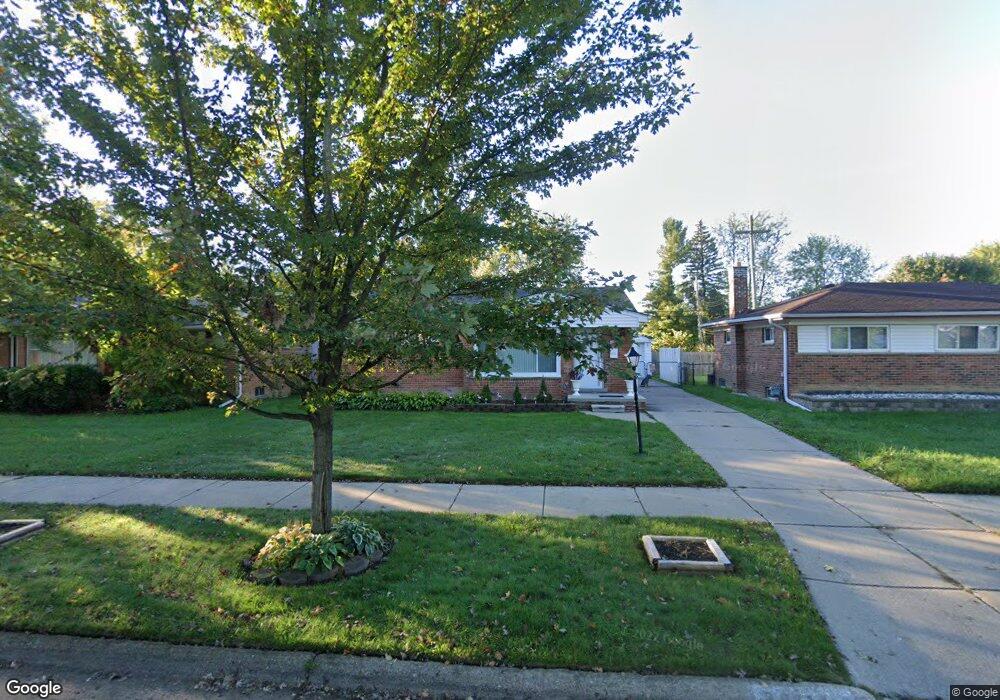
This home is located at 26317 Clarita, Redford, MI 48240 and is currently estimated at $194,493, approximately $194 per square foot. 26317 Clarita is a home located in Wayne County with nearby schools including Beech Elementary School, Hilbert Middle School, and Redford Union High School.
Ownership History
Date
Name
Owned For
Owner Type
Purchase Details
Closed on
Jul 18, 2008
Sold by
Main Lisa M and Holman Lisa
Bought by
Dimbo Monica
Current Estimated Value
Home Financials for this Owner
Home Financials are based on the most recent Mortgage that was taken out on this home.
Original Mortgage
$105,169
Outstanding Balance
$69,041
Interest Rate
6.42%
Mortgage Type
FHA
Estimated Equity
$125,452
Purchase Details
Closed on
Jun 29, 1998
Sold by
Boy Richard L Yvonne L
Bought by
Holman Lisa
Create a Home Valuation Report for This Property
The Home Valuation Report is an in-depth analysis detailing your home's value as well as a comparison with similar homes in the area
Home Values in the Area
Average Home Value in this Area
Purchase History
| Date | Buyer | Sale Price | Title Company |
|---|---|---|---|
| Dimbo Monica | $106,000 | Title Source Inc | |
| Holman Lisa | $94,000 | -- |
Source: Public Records
Mortgage History
| Date | Status | Borrower | Loan Amount |
|---|---|---|---|
| Open | Dimbo Monica | $105,169 |
Source: Public Records
Tax History Compared to Growth
Tax History
| Year | Tax Paid | Tax Assessment Tax Assessment Total Assessment is a certain percentage of the fair market value that is determined by local assessors to be the total taxable value of land and additions on the property. | Land | Improvement |
|---|---|---|---|---|
| 2025 | $780 | $78,400 | $0 | $0 |
| 2024 | $780 | $71,700 | $0 | $0 |
| 2023 | $744 | $61,800 | $0 | $0 |
| 2022 | $1,863 | $54,100 | $0 | $0 |
| 2021 | $1,811 | $51,400 | $0 | $0 |
| 2020 | $1,787 | $46,700 | $0 | $0 |
| 2019 | $1,748 | $39,000 | $0 | $0 |
| 2018 | $670 | $33,200 | $0 | $0 |
| 2017 | $1,730 | $30,800 | $0 | $0 |
| 2016 | $1,521 | $29,200 | $0 | $0 |
| 2015 | $2,408 | $26,400 | $0 | $0 |
| 2013 | $2,410 | $24,600 | $0 | $0 |
| 2012 | $1,680 | $28,400 | $6,900 | $21,500 |
Source: Public Records
Map
Nearby Homes