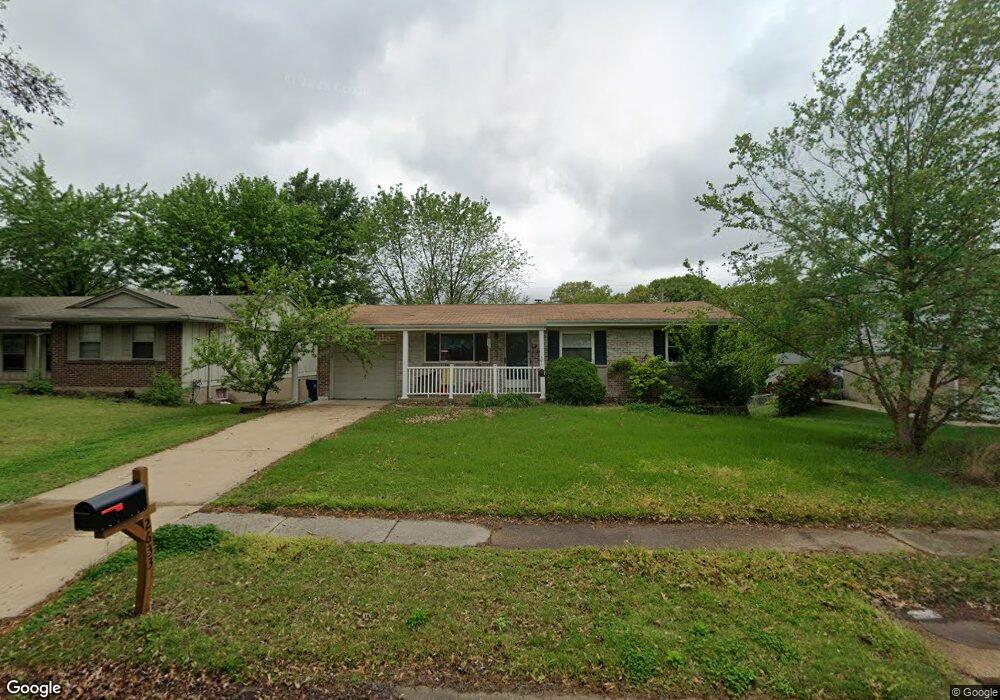
2633 Bruno Ave Saint Louis, MO 63114
Estimated Value: $210,000 - $236,000
3
Beds
2
Baths
1,148
Sq Ft
$198/Sq Ft
Est. Value
About This Home
This home is located at 2633 Bruno Ave, Saint Louis, MO 63114 and is currently estimated at $227,331, approximately $198 per square foot. 2633 Bruno Ave is a home located in St. Louis County with nearby schools including Robert Drummond Elementary School, Holman Middle School, and Pattonville High School.
Ownership History
Date
Name
Owned For
Owner Type
Purchase Details
Closed on
Sep 15, 2018
Sold by
Hankins Lisa A and Hensler Gary Steven
Bought by
Hankins Matthew K and Hankins Lisa A
Current Estimated Value
Purchase Details
Closed on
Feb 21, 2017
Sold by
Hensler Mary E and Hensler Kenneth
Bought by
Hensler Family Residence Trust
Create a Home Valuation Report for This Property
The Home Valuation Report is an in-depth analysis detailing your home's value as well as a comparison with similar homes in the area
Home Values in the Area
Average Home Value in this Area
Purchase History
| Date | Buyer | Sale Price | Title Company |
|---|---|---|---|
| Hankins Matthew K | -- | None Available | |
| Hensler Family Residence Trust | -- | None Available |
Source: Public Records
Tax History Compared to Growth
Tax History
| Year | Tax Paid | Tax Assessment Tax Assessment Total Assessment is a certain percentage of the fair market value that is determined by local assessors to be the total taxable value of land and additions on the property. | Land | Improvement |
|---|---|---|---|---|
| 2025 | $2,636 | $39,310 | $6,970 | $32,340 |
| 2024 | $2,636 | $34,270 | $6,970 | $27,300 |
| 2023 | $2,636 | $34,270 | $6,970 | $27,300 |
| 2022 | $2,161 | $25,270 | $10,070 | $15,200 |
| 2021 | $2,152 | $25,270 | $10,070 | $15,200 |
| 2020 | $2,378 | $26,850 | $8,510 | $18,340 |
| 2019 | $2,366 | $26,850 | $8,510 | $18,340 |
| 2018 | $2,257 | $23,220 | $3,190 | $20,030 |
| 2017 | $2,258 | $23,220 | $3,190 | $20,030 |
| 2016 | $1,920 | $19,640 | $4,520 | $15,120 |
| 2015 | $1,899 | $19,640 | $4,520 | $15,120 |
| 2014 | $2,105 | $21,700 | $4,520 | $17,180 |
Source: Public Records
Map
Nearby Homes
- 10719 Thorpe Ave
- 2729 Link Rd
- 10651 Thorpe Ave
- 10730 Wurdack Ave
- 2454 Prouhet Ave
- 2430 Prouhet Ave
- 10627 Canter Way
- 10726 Niblic Dr
- 2450 Fowler Ave
- 2300 Ruckert Ave
- 2412 Silkwood Dr
- 2255 N Warson Rd
- 2703 Ashby Rd
- 10490 Canter Way
- 10515 Clarendon Ave
- 3001 Ashby Rd
- 3005 Ashby Rd
- 3000 Ashby Rd
- 10235 Midland Blvd
- 10810 Hobday Ave
- 2641 Bruno Ave
- 2627 Bruno Ave
- 2617 Burns Ave
- 2654 Midland Ridge Dr
- 2658 Midland Ridge Dr
- 2647 Bruno Ave
- 2646 Midland Ridge Dr
- 2619 Bruno Ave
- 2664 Midland Ridge Dr
- 2640 Bruno Ave
- 2626 Bruno Ave
- 2653 Bruno Ave
- 2640 Midland Ridge Dr
- 2646 Bruno Ave
- 2668 Midland Ridge Dr
- 2618 Bruno Ave
- 2611 Bruno Ave
- 2652 Bruno Ave
- 2659 Bruno Ave
- 2655 Midland Ridge Dr