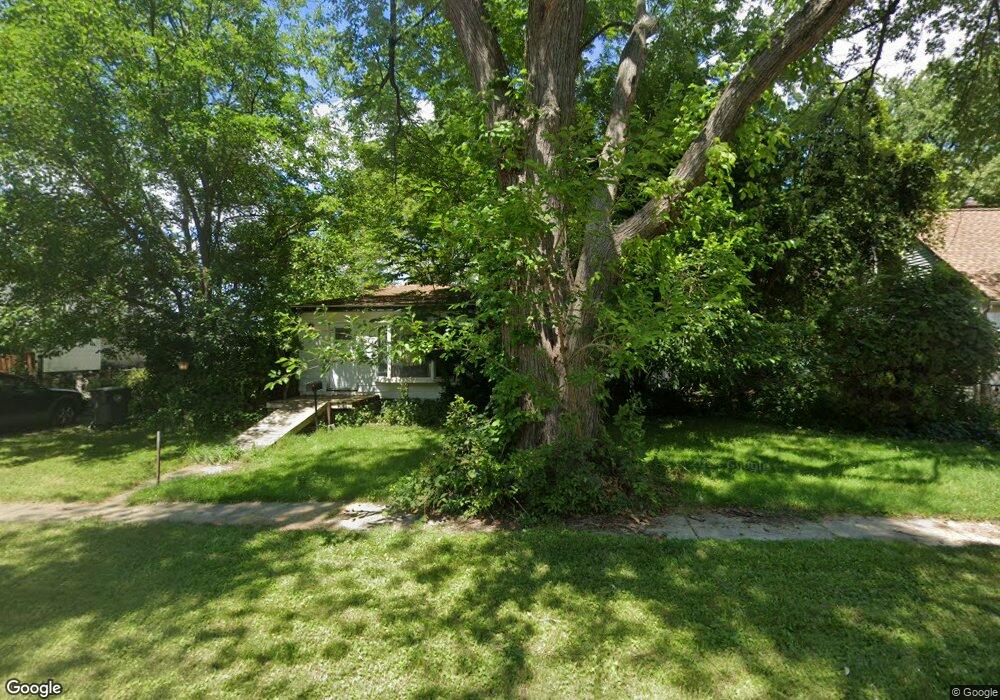
26336 Princeton St Inkster, MI 48141
Estimated Value: $112,000 - $251,973
3
Beds
1
Bath
1,000
Sq Ft
$151/Sq Ft
Est. Value
About This Home
This home is located at 26336 Princeton St, Inkster, MI 48141 and is currently estimated at $150,743, approximately $150 per square foot. 26336 Princeton St is a home located in Wayne County with nearby schools including American International Academy - Elementary, West Village Academy, and Peterson-Warren Academy.
Ownership History
Date
Name
Owned For
Owner Type
Purchase Details
Closed on
Jan 14, 2014
Sold by
Botticelli Paul James and Botticelli Eric
Bought by
Botticelli Eric
Current Estimated Value
Purchase Details
Closed on
Jan 13, 2014
Sold by
Botticelli Eric
Bought by
Mcclintock Trudy May and Aiken Gary Daniel
Purchase Details
Closed on
Sep 12, 2012
Sold by
Botticelli Eric Paul
Bought by
Botticelli Paul James
Purchase Details
Closed on
Jun 9, 2011
Sold by
Postelle Andrea
Bought by
Botticelli Eric Paul
Purchase Details
Closed on
Dec 21, 2010
Sold by
Elliott Dennis
Bought by
Postelle Andrea
Purchase Details
Closed on
Nov 29, 2010
Sold by
Wojtowicz Raymond J
Bought by
Elliott Dennis A
Purchase Details
Closed on
Oct 31, 2006
Sold by
Jpmorgan Chase Bank
Bought by
Co Equities Llc
Purchase Details
Closed on
Sep 13, 2006
Sold by
Dillard Elaine C
Bought by
Jp Morgan Chase Bank and Bank One Na
Create a Home Valuation Report for This Property
The Home Valuation Report is an in-depth analysis detailing your home's value as well as a comparison with similar homes in the area
Home Values in the Area
Average Home Value in this Area
Purchase History
| Date | Buyer | Sale Price | Title Company |
|---|---|---|---|
| Botticelli Eric | -- | None Available | |
| Mcclintock Trudy May | $1,000 | None Available | |
| Botticelli Paul James | -- | None Available | |
| Botticelli Eric Paul | $2,001 | None Available | |
| Postelle Andrea | $2,001 | None Available | |
| Elliott Dennis A | $500 | None Available | |
| Co Equities Llc | -- | E Title Agency | |
| Jp Morgan Chase Bank | $44,000 | None Available |
Source: Public Records
Tax History Compared to Growth
Tax History
| Year | Tax Paid | Tax Assessment Tax Assessment Total Assessment is a certain percentage of the fair market value that is determined by local assessors to be the total taxable value of land and additions on the property. | Land | Improvement |
|---|---|---|---|---|
| 2025 | $1,102 | $48,700 | $0 | $0 |
| 2024 | $1,102 | $39,400 | $0 | $0 |
| 2023 | $1,064 | $31,700 | $0 | $0 |
| 2022 | $1,477 | $25,600 | $0 | $0 |
| 2021 | $1,537 | $23,200 | $0 | $0 |
| 2020 | $1,503 | $19,800 | $0 | $0 |
| 2019 | $1,447 | $17,100 | $0 | $0 |
| 2018 | $968 | $15,400 | $0 | $0 |
| 2017 | $787 | $14,800 | $0 | $0 |
| 2016 | $1,412 | $15,100 | $0 | $0 |
| 2015 | $1,740 | $17,400 | $0 | $0 |
| 2013 | $2,180 | $21,800 | $0 | $0 |
| 2012 | $2,661 | $24,000 | $3,500 | $20,500 |
Source: Public Records
Map
Nearby Homes
- 26669 Norfolk St
- 26269 Dunning St
- 26703 Norfolk St
- 26160 Princeton St
- 26631 New York St
- 26115 Princeton St
- 26431 Trowbridge St
- 25960 Yale St
- 25933 Norfolk St
- 26870 Florence St
- 27044 Yale St
- 26206 Kitch St
- 26901 Kean St
- 27008 Penn St
- 26419 Carlysle St
- 25716 Notre Dame St
- 27217 Yale St
- 27018 Kitch St
- 26620 Oakland St
- 26736 Oakland St
- 26348 Princeton St
- 26406 Princeton St
- 26322 Princeton St
- 26312 Princeton St Unit Bldg-Unit
- 26312 Princeton St
- 26345 Plum St
- 26341 Plum St
- 26339 Plum St
- 26304 Princeton St
- 26337 Princeton St
- 26349 Princeton St
- 26304 Plum St
- 26311 Princeton St
- 26414 Princeton St
- 26351 Plum St
- 26432 Princeton St
- 26305 Plum St
- 26415 Princeton St
- 26423 Princeton St
- 26431 Plum St