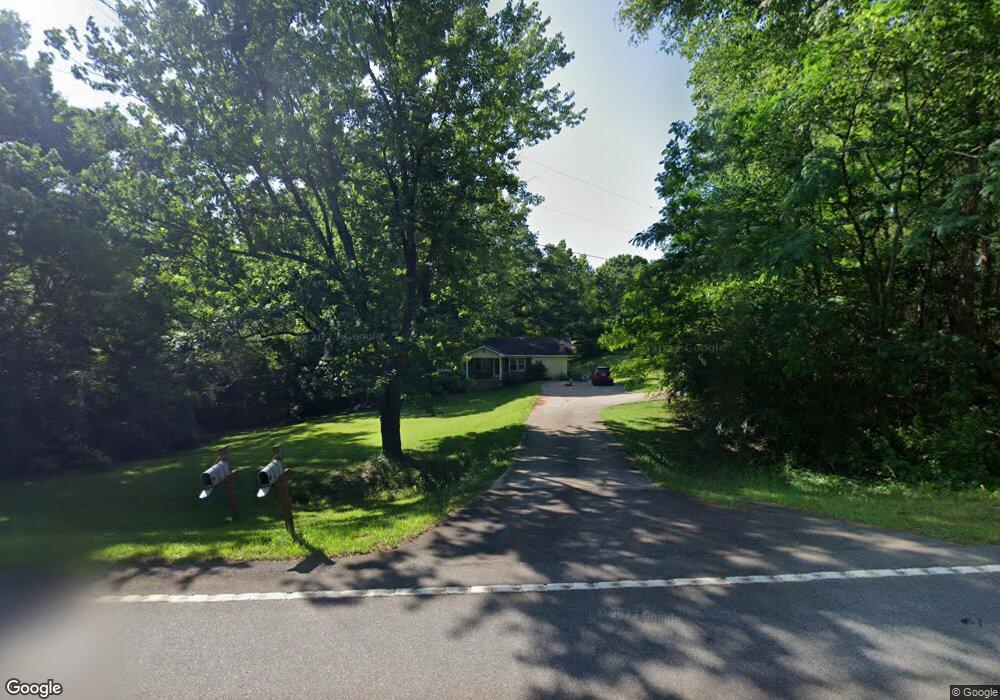
2634 Ga Highway 83 S Forsyth, GA 31029
Estimated Value: $554,000 - $623,000
5
Beds
4
Baths
4,588
Sq Ft
$126/Sq Ft
Est. Value
About This Home
This home is located at 2634 Ga Highway 83 S, Forsyth, GA 31029 and is currently estimated at $576,287, approximately $125 per square foot. 2634 Ga Highway 83 S is a home located in Monroe County with nearby schools including Samuel E. Hubbard Elementary School and Mary Persons High School.
Ownership History
Date
Name
Owned For
Owner Type
Purchase Details
Closed on
Nov 8, 2021
Sold by
Jones Robert Brent
Bought by
Sharp Clarence Lee and Sharp Kimberly Dawn
Current Estimated Value
Home Financials for this Owner
Home Financials are based on the most recent Mortgage that was taken out on this home.
Original Mortgage
$340,000
Outstanding Balance
$310,191
Interest Rate
2.99%
Mortgage Type
New Conventional
Estimated Equity
$266,096
Purchase Details
Closed on
Nov 6, 2019
Sold by
Fort Robert W
Bought by
Jones Robert Brent and Jones Rebecca J
Home Financials for this Owner
Home Financials are based on the most recent Mortgage that was taken out on this home.
Original Mortgage
$315,000
Interest Rate
3.5%
Mortgage Type
Commercial
Create a Home Valuation Report for This Property
The Home Valuation Report is an in-depth analysis detailing your home's value as well as a comparison with similar homes in the area
Home Values in the Area
Average Home Value in this Area
Purchase History
| Date | Buyer | Sale Price | Title Company |
|---|---|---|---|
| Sharp Clarence Lee | $425,000 | -- | |
| Jones Robert Brent | $166,000 | -- |
Source: Public Records
Mortgage History
| Date | Status | Borrower | Loan Amount |
|---|---|---|---|
| Open | Sharp Clarence Lee | $340,000 | |
| Previous Owner | Jones Robert Brent | $315,000 |
Source: Public Records
Tax History Compared to Growth
Tax History
| Year | Tax Paid | Tax Assessment Tax Assessment Total Assessment is a certain percentage of the fair market value that is determined by local assessors to be the total taxable value of land and additions on the property. | Land | Improvement |
|---|---|---|---|---|
| 2024 | $4,066 | $203,936 | $51,280 | $152,656 |
| 2023 | $4,039 | $180,056 | $51,280 | $128,776 |
| 2022 | $3,130 | $170,936 | $51,280 | $119,656 |
| 2021 | $2,232 | $134,380 | $51,280 | $83,100 |
| 2020 | $1,701 | $114,140 | $51,280 | $62,860 |
| 2019 | $1,620 | $114,180 | $51,320 | $62,860 |
| 2018 | $1,620 | $114,180 | $51,320 | $62,860 |
| 2017 | $3,319 | $114,180 | $51,320 | $62,860 |
| 2016 | $1,533 | $114,180 | $51,320 | $62,860 |
| 2015 | $1,451 | $114,180 | $51,320 | $62,860 |
| 2014 | $1,397 | $114,180 | $51,320 | $62,860 |
Source: Public Records
Map
Nearby Homes
- 355 Dumas Rd
- 293 AC Hopewell Rd
- 1721 Old Zebulon Rd
- 325 Parks Rd
- 301 Parks Rd
- 2088 Georgia 42
- 0 Hopewell Rd Unit 24477788
- 485 Mitchell Rd
- 656 Dolly Dr
- 289 Willis Wilder Dr
- 120 Willis Wilder Dr
- 60 Dew Place
- 299 Willis Wilder Dr
- 3319 Highway 42 S
- 394 Brookwood Dr
- 0 Zellner Rd Unit 10572316
- 0 Zellner Rd Unit 180679
- 1395 Josey Rd
- 507 W Main St
- 263 Martin Luther King jr Dr
- 2634 Ga Highway 83 S
- 2634 Ga Highway 83 S
- 2592 Ga Highway 83 S
- 2550 Georgia 83
- 2550 Ga Highway 83 S
- 2524 Ga Highway 83 S
- 2486 Ga Highway 83 S
- 2443 Brent Rd
- 2830 Ga Highway 83 S
- 2382 Brent Rd
- 2421 Georgia 83
- 2421 Ga Highway 83 S
- 2890 Ga Highway 83 S
- 2366 Ga Highway 83 S
- 76 Renouf Rd
- 288 Renouf Rd
- 2830 Georgia 83
- 50 Hopewell Rd
- 338 Renouf Rd
- 6 Renouf Rd Unit 6B 7B 8B