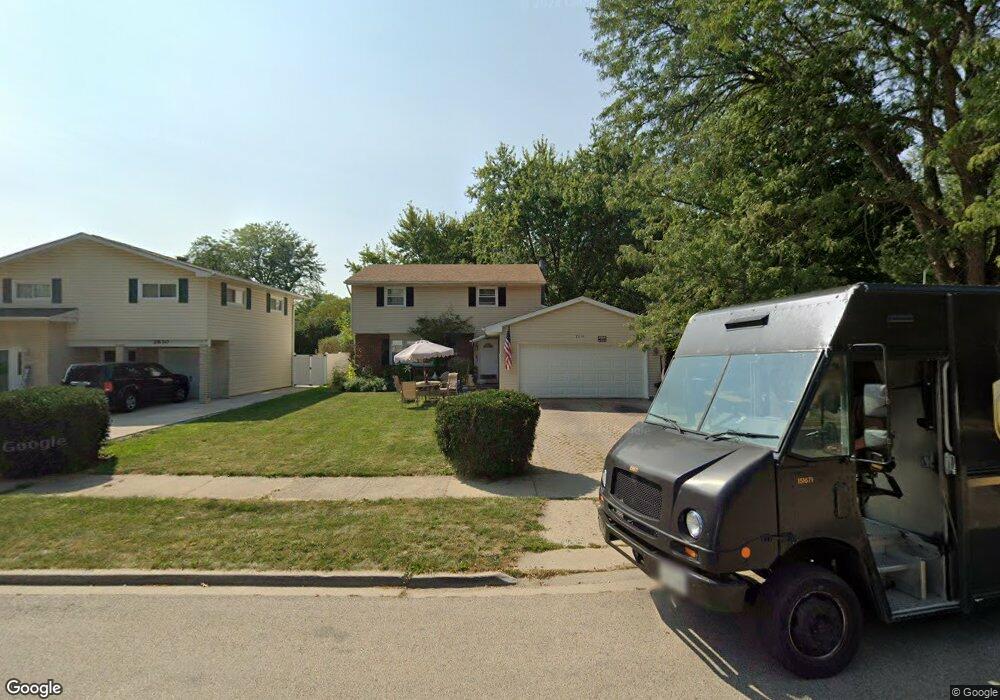
2634 Roberts Ave Waukegan, IL 60087
Estimated Value: $259,000 - $330,000
4
Beds
2
Baths
2,044
Sq Ft
$145/Sq Ft
Est. Value
About This Home
This home is located at 2634 Roberts Ave, Waukegan, IL 60087 and is currently estimated at $296,697, approximately $145 per square foot. 2634 Roberts Ave is a home located in Lake County with nearby schools including Oakdale Elementary School, Jack Benny Middle School, and Waukegan High School.
Ownership History
Date
Name
Owned For
Owner Type
Purchase Details
Closed on
Aug 20, 2025
Sold by
Rivera Angel
Bought by
Armanov Biberce Valentino
Current Estimated Value
Home Financials for this Owner
Home Financials are based on the most recent Mortgage that was taken out on this home.
Original Mortgage
$242,500
Outstanding Balance
$242,071
Interest Rate
6.63%
Mortgage Type
New Conventional
Estimated Equity
$54,626
Purchase Details
Closed on
Oct 16, 2003
Sold by
Allwardt Mary and Allwardt Wayne
Bought by
Rivera Angel
Purchase Details
Closed on
Sep 11, 2000
Sold by
Allwardt Mary
Bought by
Rivera Angel and Banegas Elisa
Purchase Details
Closed on
Sep 8, 2000
Sold by
Randall Robert A
Bought by
Allwardt Mary
Purchase Details
Closed on
Oct 23, 1997
Sold by
Randall Ahna L
Bought by
Randall Robert A
Home Financials for this Owner
Home Financials are based on the most recent Mortgage that was taken out on this home.
Original Mortgage
$108,000
Interest Rate
7.43%
Create a Home Valuation Report for This Property
The Home Valuation Report is an in-depth analysis detailing your home's value as well as a comparison with similar homes in the area
Home Values in the Area
Average Home Value in this Area
Purchase History
| Date | Buyer | Sale Price | Title Company |
|---|---|---|---|
| Armanov Biberce Valentino | $250,000 | Fidelity National Title | |
| Rivera Angel | $131,093 | Attorney | |
| Rivera Angel | -- | None Available | |
| Allwardt Mary | -- | -- | |
| Allwardt Mary | $156,000 | -- | |
| Randall Robert A | -- | -- |
Source: Public Records
Mortgage History
| Date | Status | Borrower | Loan Amount |
|---|---|---|---|
| Open | Armanov Biberce Valentino | $242,500 | |
| Previous Owner | Randall Robert A | $108,000 |
Source: Public Records
Tax History Compared to Growth
Tax History
| Year | Tax Paid | Tax Assessment Tax Assessment Total Assessment is a certain percentage of the fair market value that is determined by local assessors to be the total taxable value of land and additions on the property. | Land | Improvement |
|---|---|---|---|---|
| 2024 | $6,899 | $81,718 | $11,727 | $69,991 |
| 2023 | $6,899 | $73,162 | $10,499 | $62,663 |
| 2022 | $6,673 | $68,256 | $10,591 | $57,665 |
| 2021 | $7,231 | $69,357 | $9,447 | $59,910 |
| 2020 | $7,324 | $64,614 | $8,801 | $55,813 |
| 2019 | $7,371 | $59,209 | $8,065 | $51,144 |
| 2018 | $7,103 | $54,940 | $10,432 | $44,508 |
| 2017 | $6,914 | $48,606 | $9,229 | $39,377 |
| 2016 | $6,043 | $39,107 | $7,426 | $31,681 |
| 2015 | $5,912 | $35,001 | $6,646 | $28,355 |
| 2014 | $6,178 | $36,514 | $6,519 | $29,995 |
| 2012 | $8,056 | $39,560 | $7,063 | $32,497 |
Source: Public Records
Map
Nearby Homes
- 2708 Dana Ave
- 2705 Dana Ave
- 2924 W Bonnie Brook Ln
- 2345 N Mcaree Rd
- 2713 Varonen Ave
- 3101 Country Club Ln
- 36955 N Garrick Ave
- 2613 N Lewis Ave
- 3032 W Vermont Ave
- 2350 N Lewis Ave
- 36245 N Green Bay Rd
- 3320 Sunset Ave
- 1636 Rice St
- 2928 W Country Club Ave
- 3000 W Country Club Ave
- 2946 W Country Club Ave
- 12535 W Blanchard Rd
- 2440 W Cheyenne Rd
- 2715 W Greenwood Ave
- 37966 N Cornell Rd
- 2638 Roberts Ave
- 2626 Roberts Ave
- 2633 N Evergreen Ave
- 2629 N Evergreen Ave
- 2637 N Evergreen Ave
- 2642 Roberts Ave
- 2625 N Evergreen Ave
- 2646 Roberts Ave
- 2633 Roberts Ave
- 2637 Roberts Ave
- 2620 Roberts Ave
- 2629 Roberts Ave
- 2641 N Evergreen Ave
- 2621 N Evergreen Ave
- 2614 Blanchard Rd
- 2645 Roberts Ave
- 2641 Roberts Ave
- 2625 Roberts Ave
- 2640 N Evergreen Ave