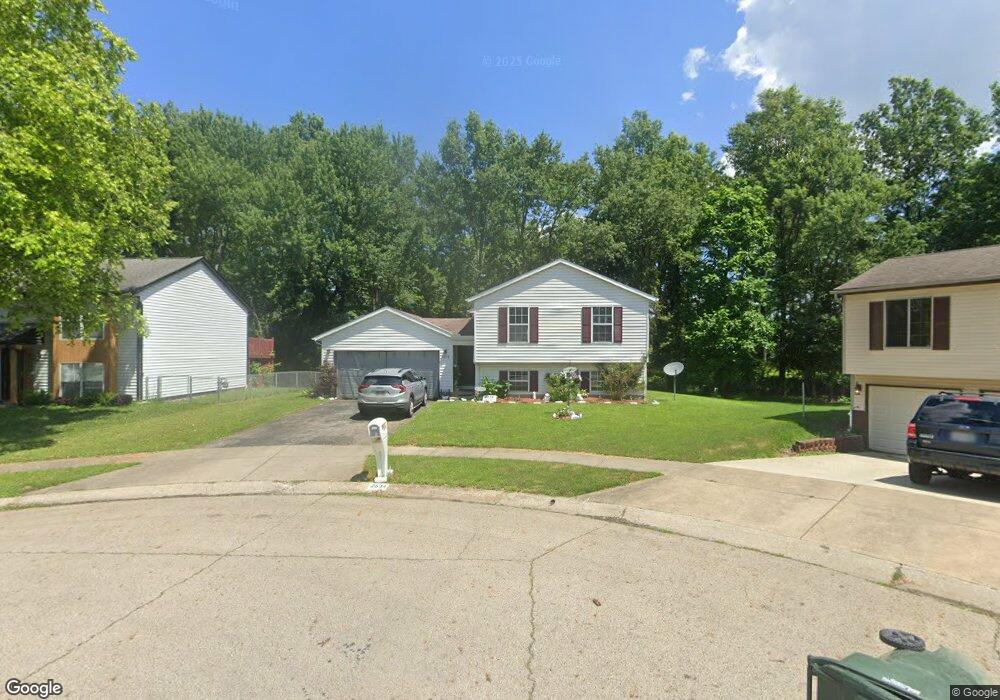
2634 Stacie Ln Columbus, OH 43224
Walnut Creek NeighborhoodEstimated Value: $203,000 - $310,000
3
Beds
2
Baths
1,886
Sq Ft
$140/Sq Ft
Est. Value
About This Home
This home is located at 2634 Stacie Ln, Columbus, OH 43224 and is currently estimated at $263,204, approximately $139 per square foot. 2634 Stacie Ln is a home located in Franklin County with nearby schools including Innis Elementary School, Mifflin Middle School, and Mifflin High School.
Ownership History
Date
Name
Owned For
Owner Type
Purchase Details
Closed on
Sep 23, 2008
Sold by
Deutsche Bank National Trust Co
Bought by
Devlin Yolanda
Current Estimated Value
Home Financials for this Owner
Home Financials are based on the most recent Mortgage that was taken out on this home.
Original Mortgage
$73,781
Outstanding Balance
$49,192
Interest Rate
6.57%
Mortgage Type
FHA
Estimated Equity
$214,012
Purchase Details
Closed on
May 6, 2008
Sold by
Littlejohn Tracy and Case #07Cve09 12669
Bought by
Deutsche Bank National Trust Co and Pooling & Servicing Agreement Equifirst
Purchase Details
Closed on
Dec 29, 2006
Sold by
Freeze Linda L and Peaks Ronald J
Bought by
Littlejohn Tracy and Brown Kenneth
Home Financials for this Owner
Home Financials are based on the most recent Mortgage that was taken out on this home.
Original Mortgage
$110,000
Interest Rate
10.2%
Mortgage Type
Purchase Money Mortgage
Purchase Details
Closed on
Jul 17, 1991
Bought by
Ware Linda L
Purchase Details
Closed on
Mar 23, 1990
Create a Home Valuation Report for This Property
The Home Valuation Report is an in-depth analysis detailing your home's value as well as a comparison with similar homes in the area
Home Values in the Area
Average Home Value in this Area
Purchase History
| Date | Buyer | Sale Price | Title Company |
|---|---|---|---|
| Devlin Yolanda | $74,000 | Sovereign | |
| Deutsche Bank National Trust Co | $74,000 | None Available | |
| Littlejohn Tracy | $110,000 | Talon Group | |
| Ware Linda L | $77,800 | -- | |
| -- | $70,000 | -- |
Source: Public Records
Mortgage History
| Date | Status | Borrower | Loan Amount |
|---|---|---|---|
| Open | Devlin Yolanda | $73,781 | |
| Previous Owner | Littlejohn Tracy | $110,000 |
Source: Public Records
Tax History Compared to Growth
Tax History
| Year | Tax Paid | Tax Assessment Tax Assessment Total Assessment is a certain percentage of the fair market value that is determined by local assessors to be the total taxable value of land and additions on the property. | Land | Improvement |
|---|---|---|---|---|
| 2024 | $2,787 | $62,090 | $16,100 | $45,990 |
| 2023 | $2,751 | $62,090 | $16,100 | $45,990 |
| 2022 | $1,521 | $29,330 | $6,580 | $22,750 |
| 2021 | $1,524 | $29,330 | $6,580 | $22,750 |
| 2020 | $1,623 | $29,330 | $6,580 | $22,750 |
| 2019 | $1,423 | $23,450 | $5,250 | $18,200 |
| 2018 | $1,342 | $23,450 | $5,250 | $18,200 |
| 2017 | $1,585 | $29,330 | $5,250 | $24,080 |
| 2016 | $1,392 | $21,010 | $5,080 | $15,930 |
| 2015 | $1,263 | $21,010 | $5,080 | $15,930 |
| 2014 | $1,267 | $21,010 | $5,080 | $15,930 |
| 2013 | $625 | $21,000 | $5,075 | $15,925 |
Source: Public Records
Map
Nearby Homes
- 2551-2553 Woodsedge Rd
- 2450 Winding Hills Ct Unit 2450
- 2853 Stonecreek Ct Unit 2853
- 3609 Westerville Rd Unit P-49
- 2621 Ipswick Cir
- 2781 Innis Rd Unit C
- 2781 Innis Rd Unit F
- 2547 Ferris Park Dr S
- 2529 Ferris Park Dr S
- 2503 Hingham Ln
- 2640 Milverton Way
- 4165 Sunbury Rd
- 2220 Sale Rd
- 2283 Ward Rd
- 4090 Cleveland Ave
- 4161 Grayfriars Ln
- 3685 Cleveland Ave
- 2015 Melrose Ave
- 3335 Sycamore Knoll Dr
- 3137 Westerville Rd Unit 44
- 2626 Stacie Ln
- 2642 Stacie Ln
- 2616 Stacie Ln
- 2641 Stacie Ln
- 2608 Stacie Ln
- 2625 Stacie Ln
- 2633 Stacie Ln
- 0 Staci Ln
- 3551 Tara Ct
- 2600 Stacie Ln
- 2630 Woodsedge Rd
- 2640 Woodsedge Rd
- 2601 Stacie Ln
- 2622 Woodsedge Rd
- 2660 Woodsedge Rd
- 2592 Stacie Ln
- 3537 Tara Ct
- 2593 Stacie Ln
- 2574 Staci Ln
- 2571 Staci Ln