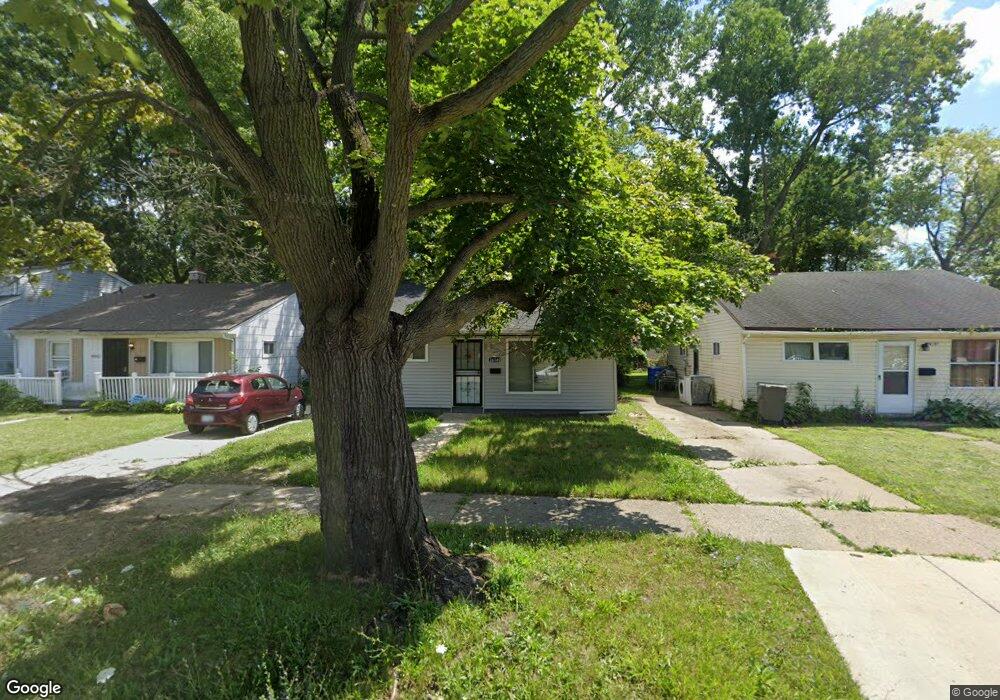
26349 Colgate St Inkster, MI 48141
Estimated Value: $91,931 - $108,000
3
Beds
1
Bath
952
Sq Ft
$101/Sq Ft
Est. Value
About This Home
This home is located at 26349 Colgate St, Inkster, MI 48141 and is currently estimated at $96,233, approximately $101 per square foot. 26349 Colgate St is a home located in Wayne County with nearby schools including West Village Academy and Peterson-Warren Academy.
Ownership History
Date
Name
Owned For
Owner Type
Purchase Details
Closed on
Oct 10, 2024
Sold by
Platinum Acquisitions Llc
Bought by
C G Mi Acquisitions Llc
Current Estimated Value
Purchase Details
Closed on
May 5, 2019
Sold by
Squires Samuel J
Bought by
Platinum Cquisitions Llc
Purchase Details
Closed on
May 12, 2015
Sold by
Rvfm 4 Series Llc
Bought by
Squires Samuel J
Purchase Details
Closed on
Nov 7, 2013
Sold by
Wayne County Treasurer
Bought by
Rvfm 4 Llc
Purchase Details
Closed on
Nov 29, 2010
Sold by
Wojtowicz Raymond J
Bought by
I L A Investments Corporation
Purchase Details
Closed on
May 6, 2003
Sold by
Va
Bought by
Johnson Dorothy L
Purchase Details
Closed on
Apr 30, 2003
Sold by
I Buy Houses Cash Inc
Bought by
Orr Wallace
Purchase Details
Closed on
Apr 15, 2003
Sold by
Bey Carla Y
Bought by
I Buy Houses Cash Inc
Create a Home Valuation Report for This Property
The Home Valuation Report is an in-depth analysis detailing your home's value as well as a comparison with similar homes in the area
Home Values in the Area
Average Home Value in this Area
Purchase History
| Date | Buyer | Sale Price | Title Company |
|---|---|---|---|
| C G Mi Acquisitions Llc | -- | Coretitle | |
| Mount North Capital 5 Llc | $858,000 | Coretitle | |
| C G Mi Acquisitions Llc | -- | Coretitle | |
| Platinum Cquisitions Llc | -- | None Available | |
| Squires Samuel J | $1,000 | None Available | |
| Rvfm 4 Llc | $500 | None Available | |
| I L A Investments Corporation | $1,000 | None Available | |
| Johnson Dorothy L | -- | Chirco Title Company | |
| Orr Wallace | $15,500 | Lawyers Title Insurance Co | |
| I Buy Houses Cash Inc | $5,000 | Lawyers Title Insurance Co |
Source: Public Records
Tax History Compared to Growth
Tax History
| Year | Tax Paid | Tax Assessment Tax Assessment Total Assessment is a certain percentage of the fair market value that is determined by local assessors to be the total taxable value of land and additions on the property. | Land | Improvement |
|---|---|---|---|---|
| 2025 | $988 | $34,600 | $0 | $0 |
| 2024 | $988 | $28,000 | $0 | $0 |
| 2023 | $955 | $0 | $0 | $0 |
| 2022 | $1,331 | $18,100 | $0 | $0 |
| 2021 | $529 | $16,400 | $0 | $0 |
| 2020 | $1,353 | $14,000 | $0 | $0 |
| 2019 | $1,074 | $12,000 | $0 | $0 |
| 2018 | $710 | $10,900 | $0 | $0 |
| 2017 | $601 | $10,500 | $0 | $0 |
| 2016 | $1,047 | $10,700 | $0 | $0 |
| 2015 | $1,320 | $13,200 | $0 | $0 |
| 2013 | $1,650 | $16,500 | $0 | $0 |
| 2012 | $1,267 | $18,200 | $1,700 | $16,500 |
Source: Public Records
Map
Nearby Homes
- 4110 John Daly St
- 26231 Andover St
- 26202 Colgate St
- 26458 Hopkins St
- 26159 Stanford St
- 26439 Hopkins St
- 26773 Colgate St
- 26653 Ross St
- 26419 Carlysle St
- 26860 Andover St
- 26225 McDonald St
- 26916 Andover St
- 4863 Glenis St
- 25866 Andover St
- 0000 Ross Ross St
- 27022 Colgate St
- 26206 Kitch St
- 25895 Annapolis St
- 26532 Powers Ave
- 4061 Wellington St
- 26341 Colgate St
- 26357 Colgate St
- 26365 Colgate St
- 26333 Colgate St
- 26405 Colgate St
- 26323 Colgate St
- 26348 Stanford St
- 26340 Stanford St
- 26356 Stanford St
- 26413 Colgate St
- 26332 Stanford St
- 26364 Stanford St
- 26313 Colgate St
- 26421 Colgate St
- 26412 Stanford St
- 4052 Bayhan St Unit Bldg-Unit
- 4052 Bayhan St
- 26312 Stanford St
- 26429 Colgate St
- 26420 Stanford St Unit Bldg-Unit